
DevTools extension
The Chrome DevTools panel for Sp00ky apps: live queries and their timings, the local cache, storage health, sessions, feature flags, impersonation, stack versions and the client event log.
Sp00ky ships a Chrome DevTools extension. It adds a panel called 00 next to Elements and Network, and it inspects the live client in the page you have open: the queries it is running, what they cost, what is in the local cache, who the session belongs to, and what the backend it is talking to is running.
It works against a deployed app exactly as it does against localhost. Nothing
is compiled out of a production build, so the panel that explains a slow query
on your machine explains the same query on the deployment your users are on.
Installing it
The extension is published to the Chrome Web Store on every release. Search for Sp00ky DevTools and add it. To run the version in this repository instead:
Then open chrome://extensions, turn on Developer mode, choose Load
unpacked, and select apps/devtools/dist.
Either way, open DevTools on a page running a Sp00ky app and pick the 00 tab.
Nothing to wire up, in dev or in production
There is no setup step, no config flag and no dev-only build. Every
Sp00kyClient exposes window.__00__ when it is constructed, and the panel
reads the client through it. Open DevTools on your staging URL, on your
production URL, on a colleague’s deployment, and the panel is there.
That costs an uninspected app nothing. The push channel stays dormant until a panel (or the MCP bridge) handshakes with the page, so a production client nobody is looking at does no serialization work for it. Opening the panel is what turns the channel on, and closing it turns the channel back off.
Inspecting production is not a privilege escalation. Every read goes through the client, which goes through SurrealDB as the signed-in user, so the panel sees exactly the rows that session is allowed to see and nothing more. The one exception is deliberate and admin-gated: impersonation, which the database authorizes and audits.
The toolbar
Every tab shares one toolbar.
- The status dot on the left reports whether a Sp00ky client is reachable. A tab can run more than one (the main document plus any iframe that embeds the app) and the panel inspects exactly one at a time, so the dot grows into a picker as soon as there is a second client to choose between.
- The heartbeat badge on the right is the scheduler’s end-to-end sync latency: one probe row written upstream, timed through ingest, broadcast and the SSP circuit. It is absent (not zero) when the probe is off or the scheduler is unreachable, and clicking it opens the Stack tab where the history lives.
- Refresh re-reads what the tab you are on actually shows: the table list on Database, the flags on Access, version discovery on Stack. Shift-click refreshes everything.
- Clear empties the event log.
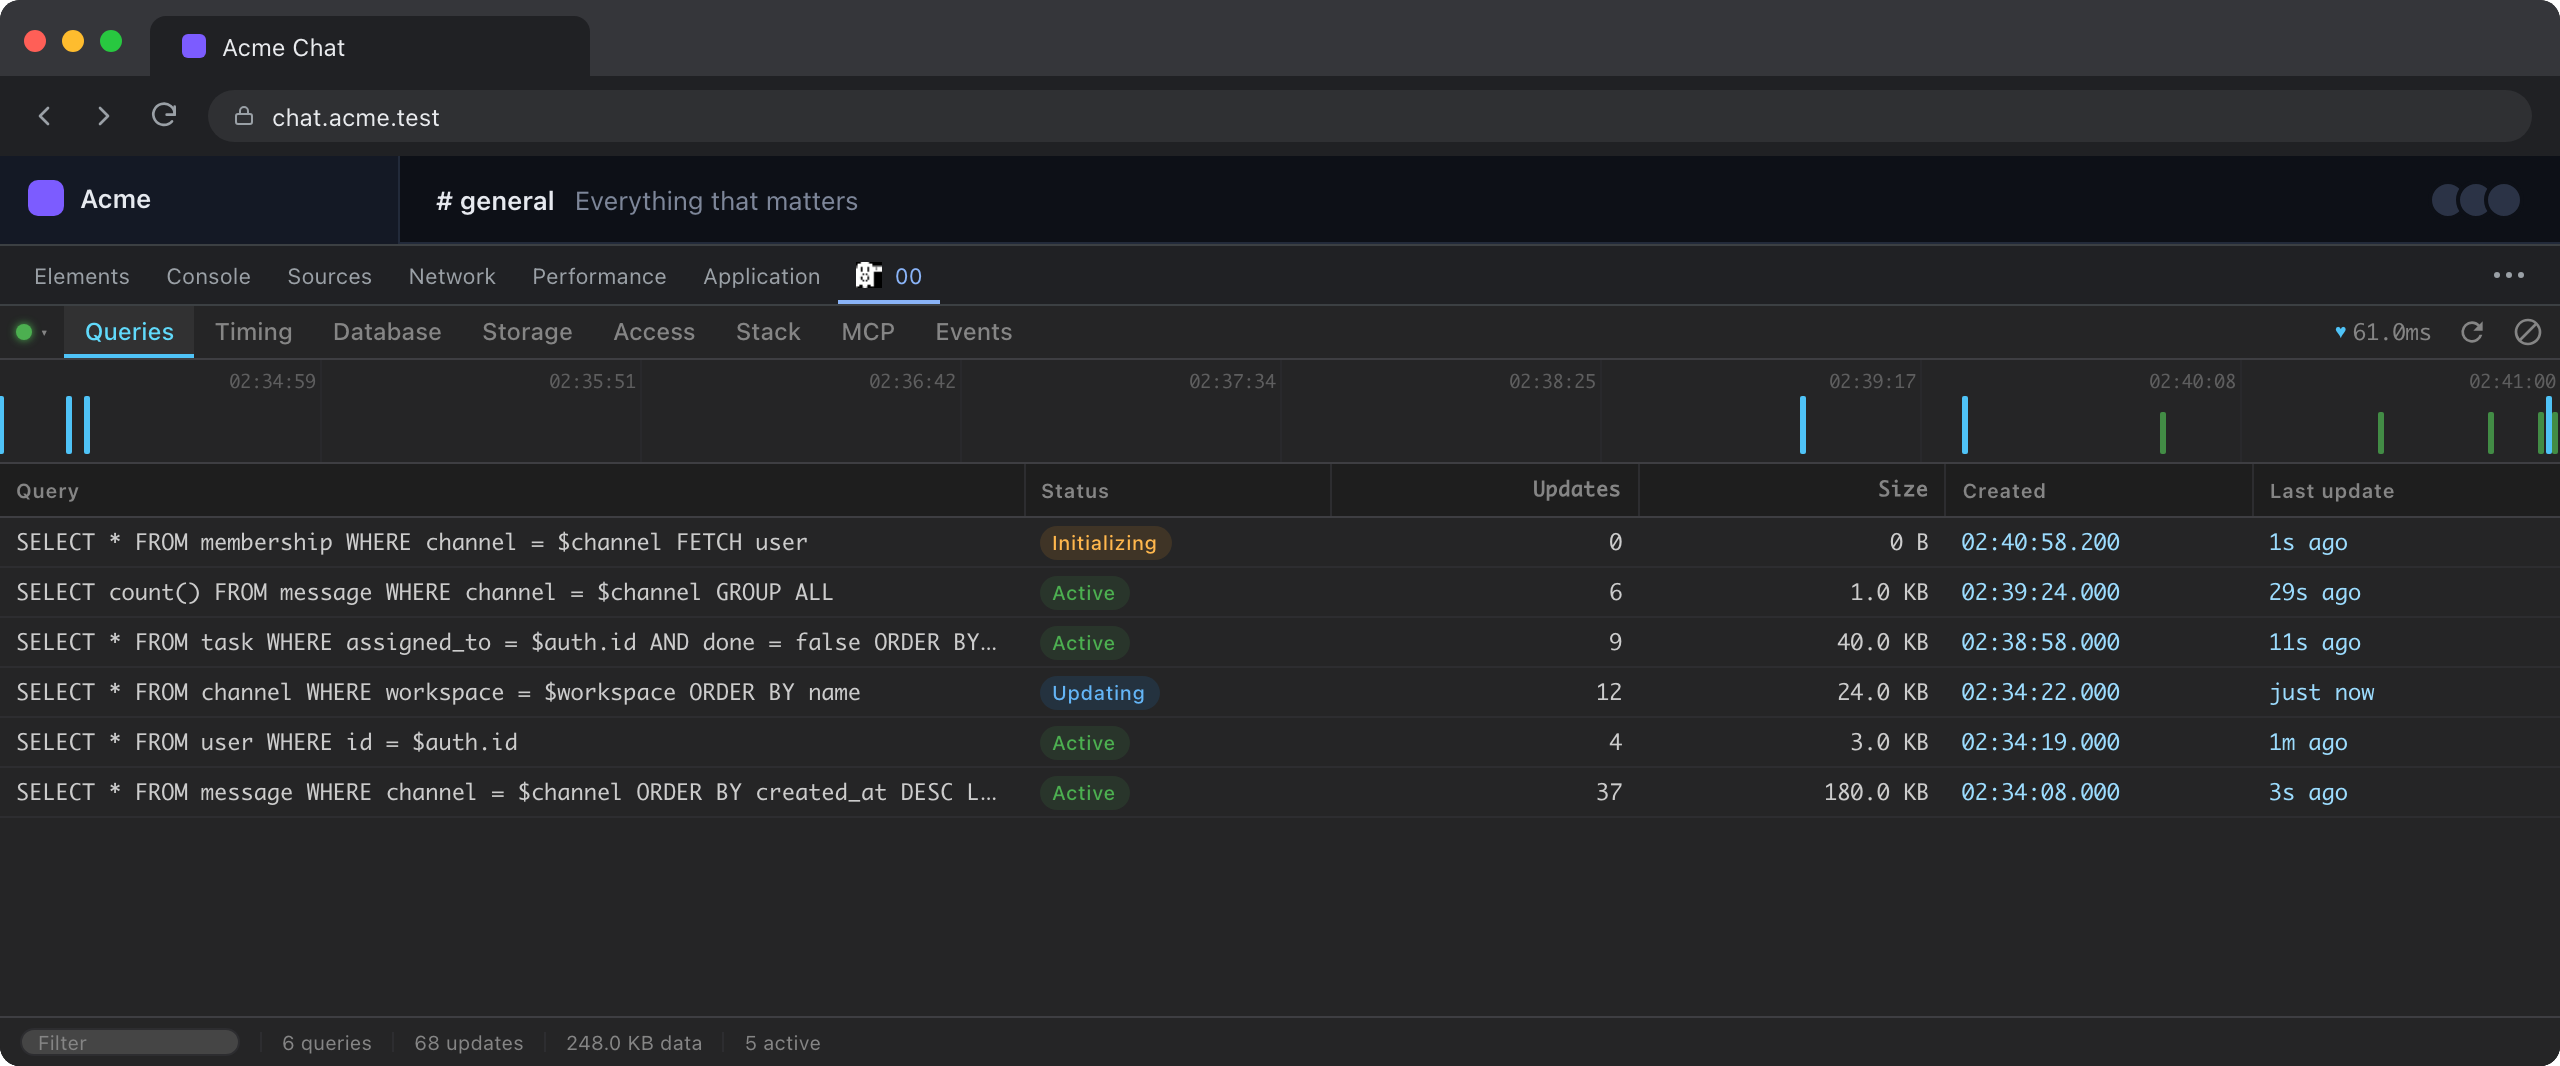
Queries
The queries the client has registered, newest first, with their status, how many updates each has received, how much data it is holding and when it last changed. The strip along the top is a timeline of registrations and updates, so a query that is updating far more often than the rest is visible without reading a single number.
Click a query to open its detail panel.
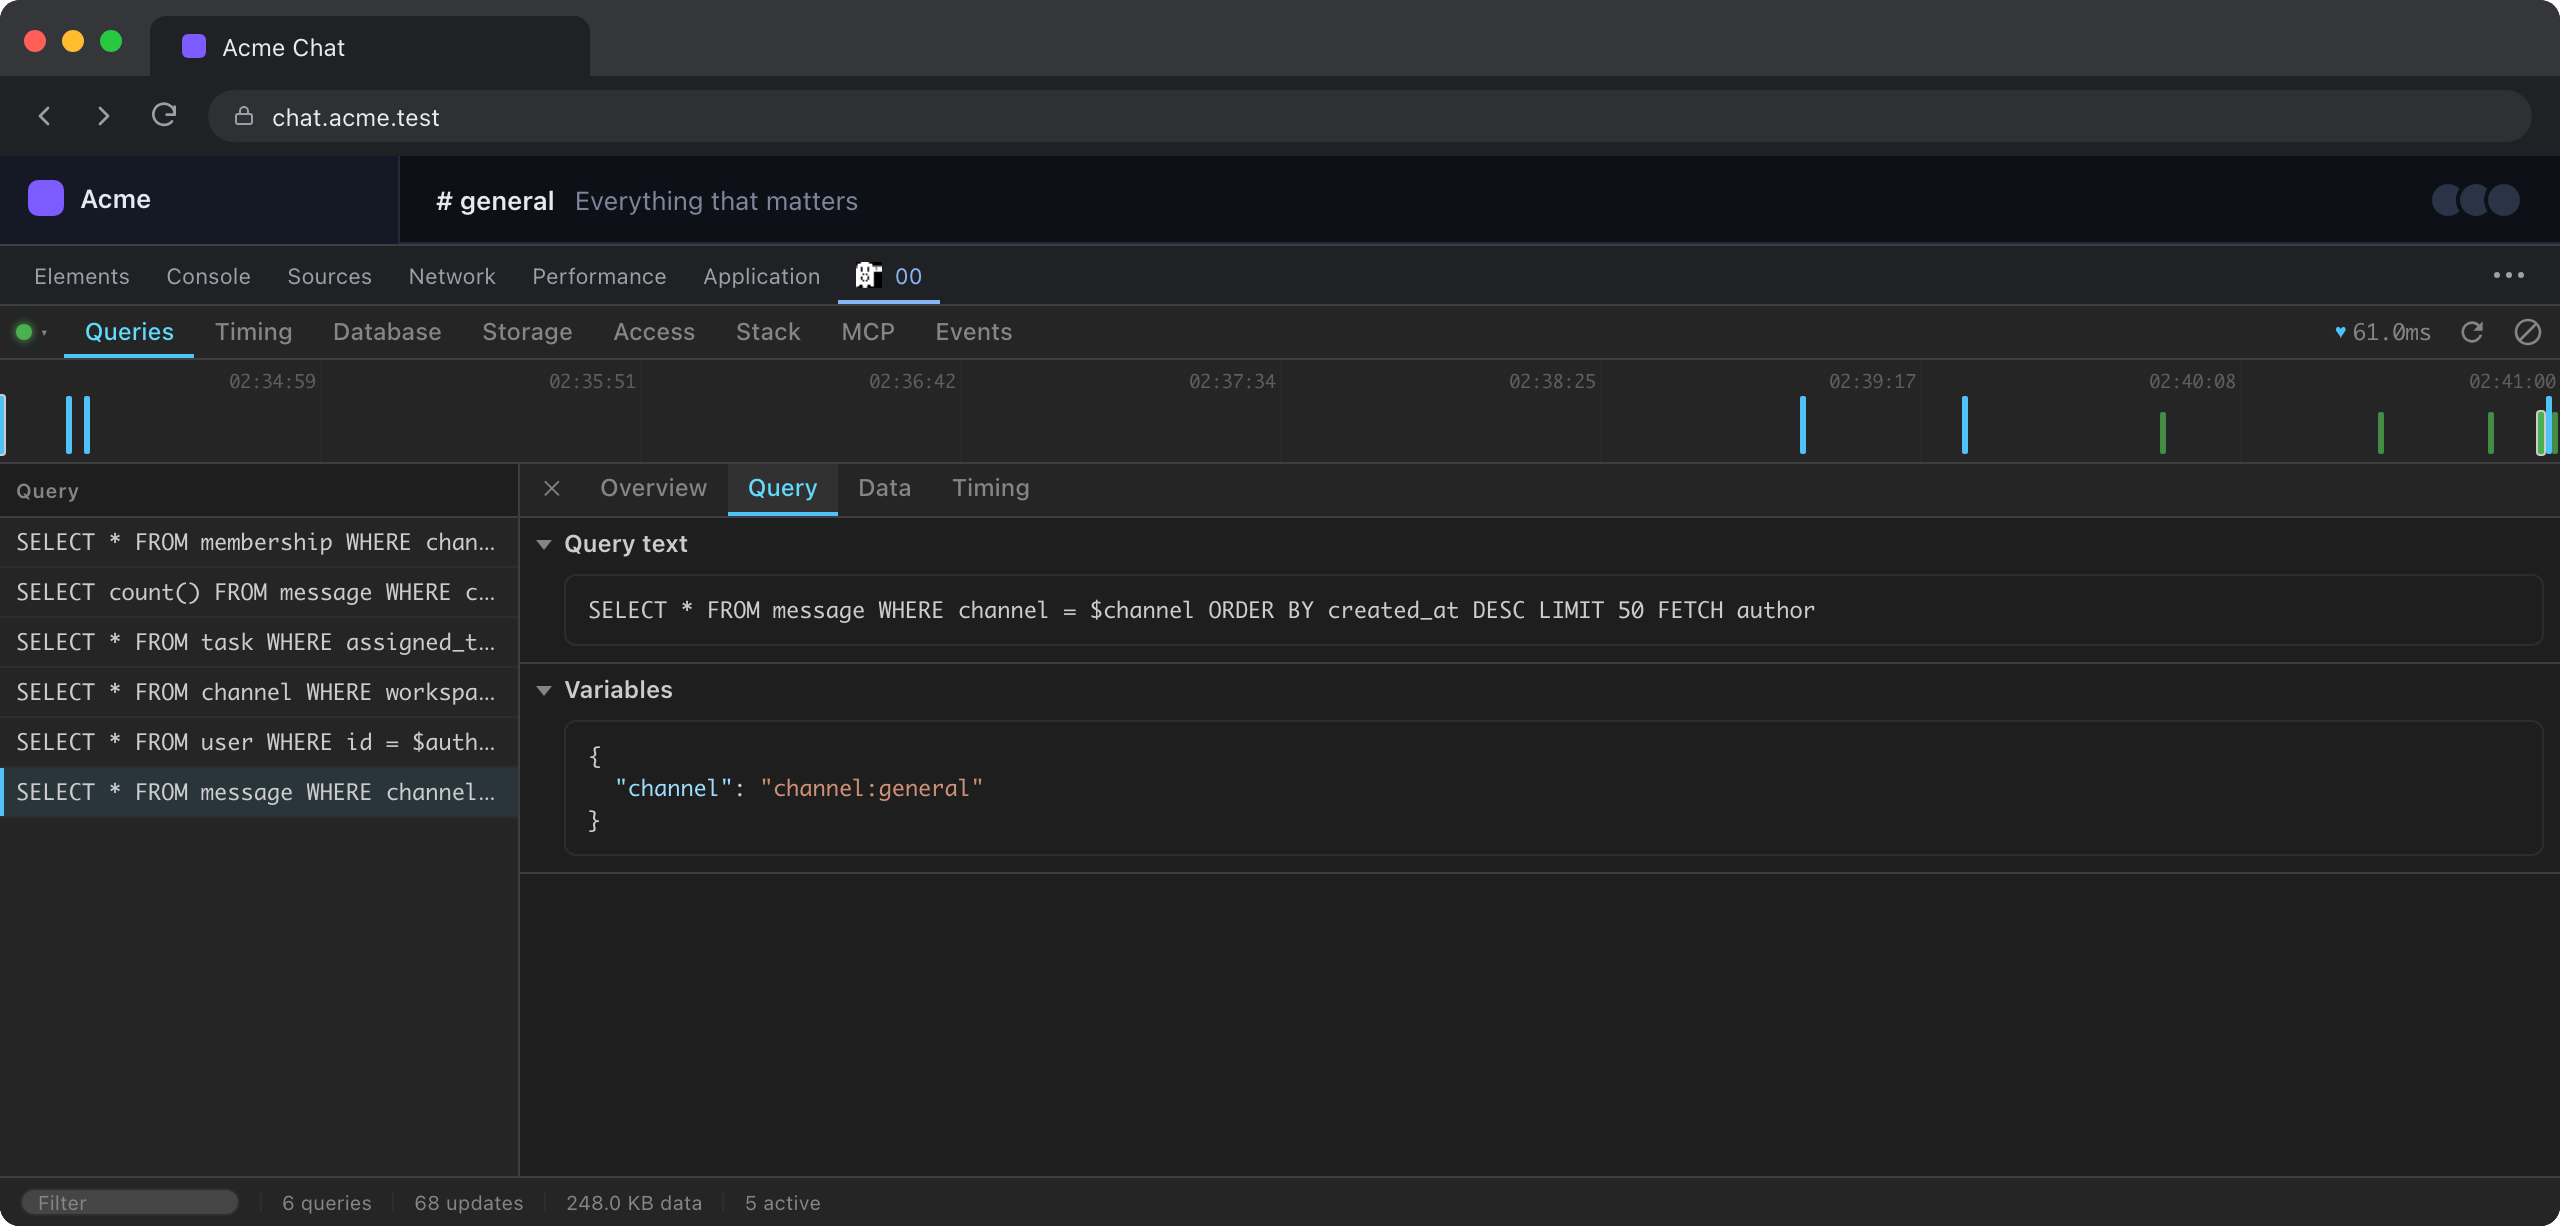
The detail panel has four sections, and hides the ones a query has nothing for:
| Section | Shows |
|---|---|
| Overview | Hash, status, TTL, creation and last-update times, update count, payload size. |
| Query | The registered SurrealQL and its variables. |
| Data | The rows themselves, plus the local and remote membership arrays. |
| Timing | The full per-phase breakdown for this one query. |
Rows are fetched only when you open the Data section. The state the page pushes carries counts and capped ids, never the full result set of every live query.
Timing
Every live query against every phase of the pipeline, slowest first. Each column is that phase’s p90, and the Total bar is the sum, so the offending query and the phase it is stuck in are one glance apart.
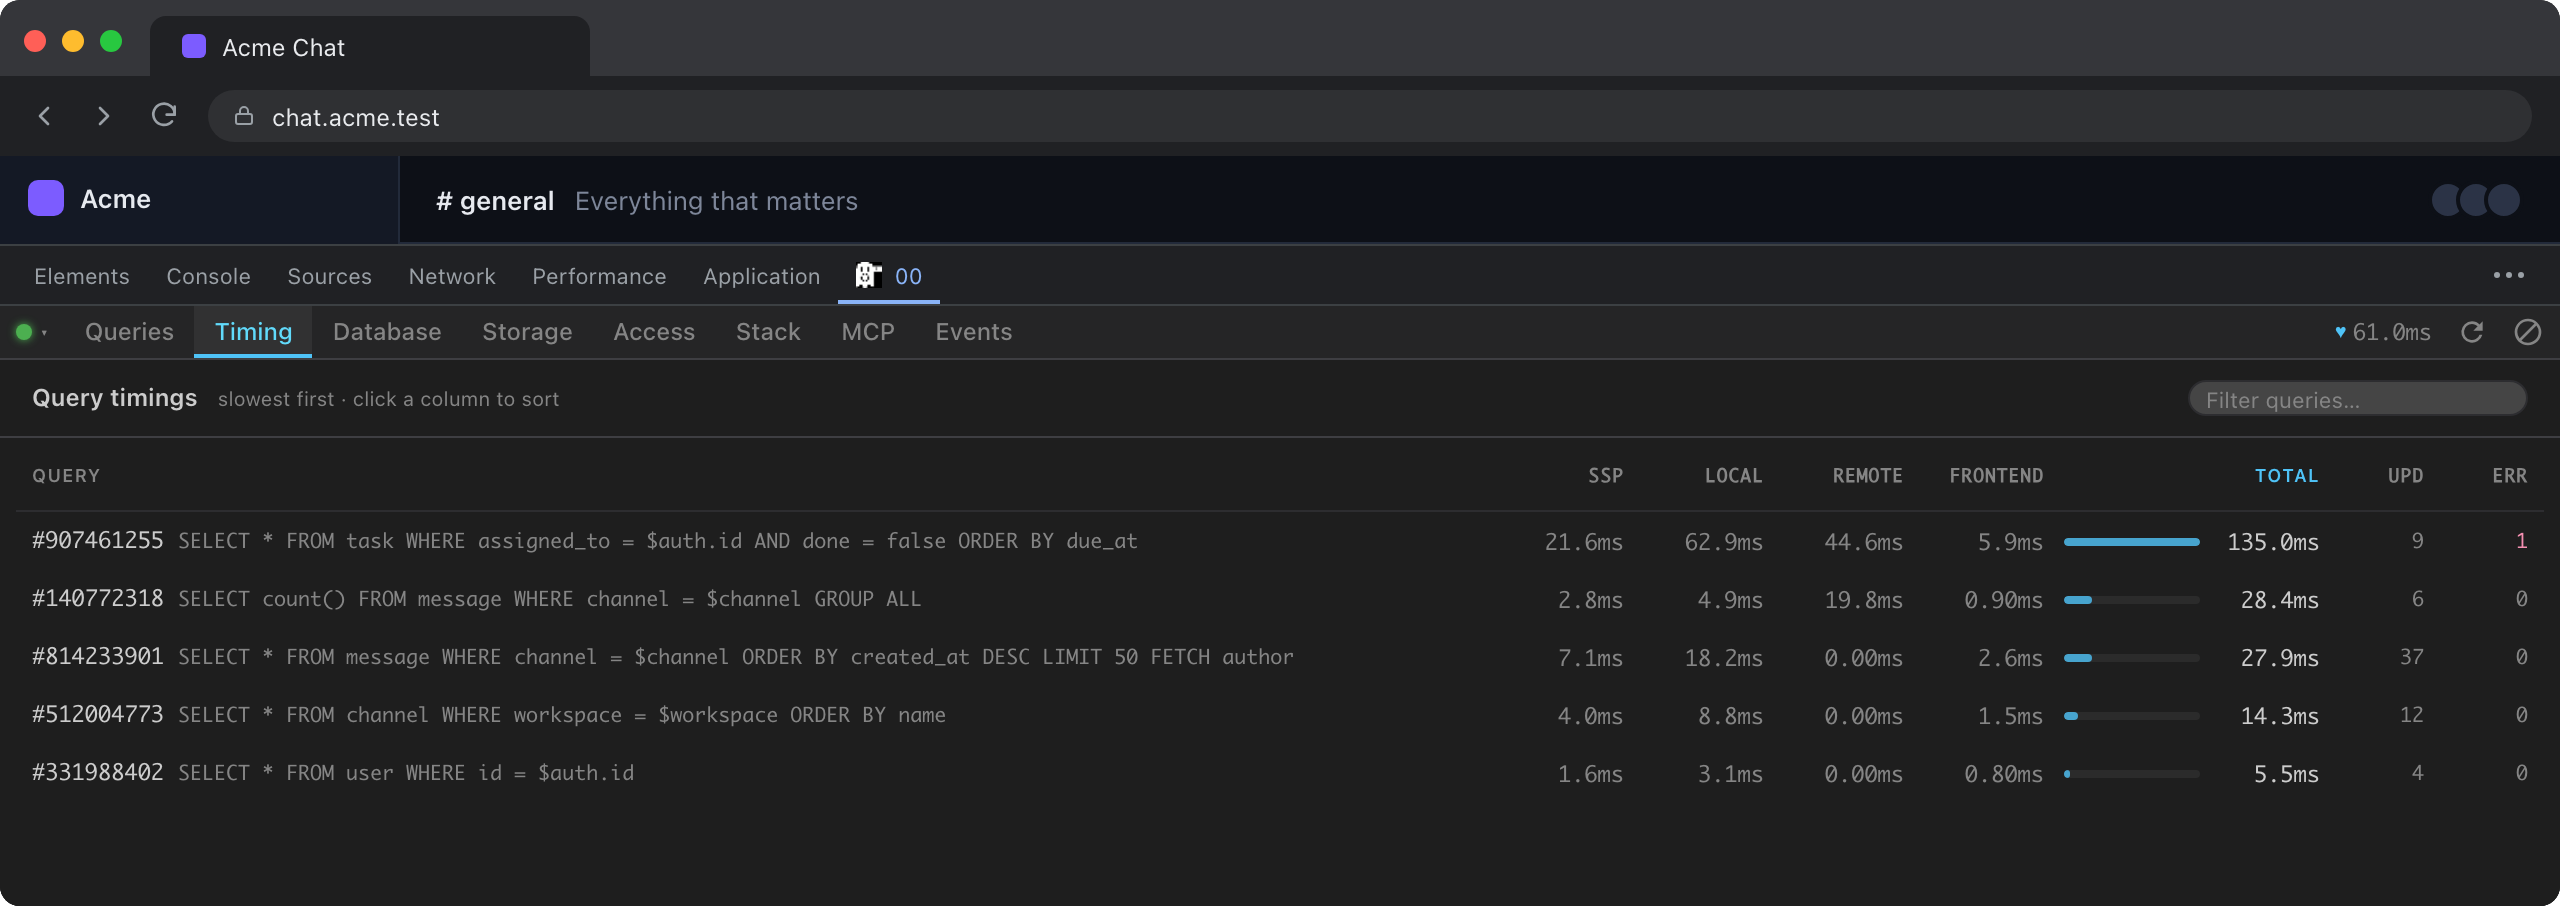
SSP is the server-side view step, Local the local cache read, Remote the
round trip to the database when a query still needs one, and Frontend the
reconcile into your components. upd and err are the update and error counts.
Clicking a #hash jumps to that query in the Queries tab with its detail panel
open.
Database
A table browser over the client’s own data, backed either by the local cache or by the remote database. The dropdown switches between them and the rest of the tab follows.
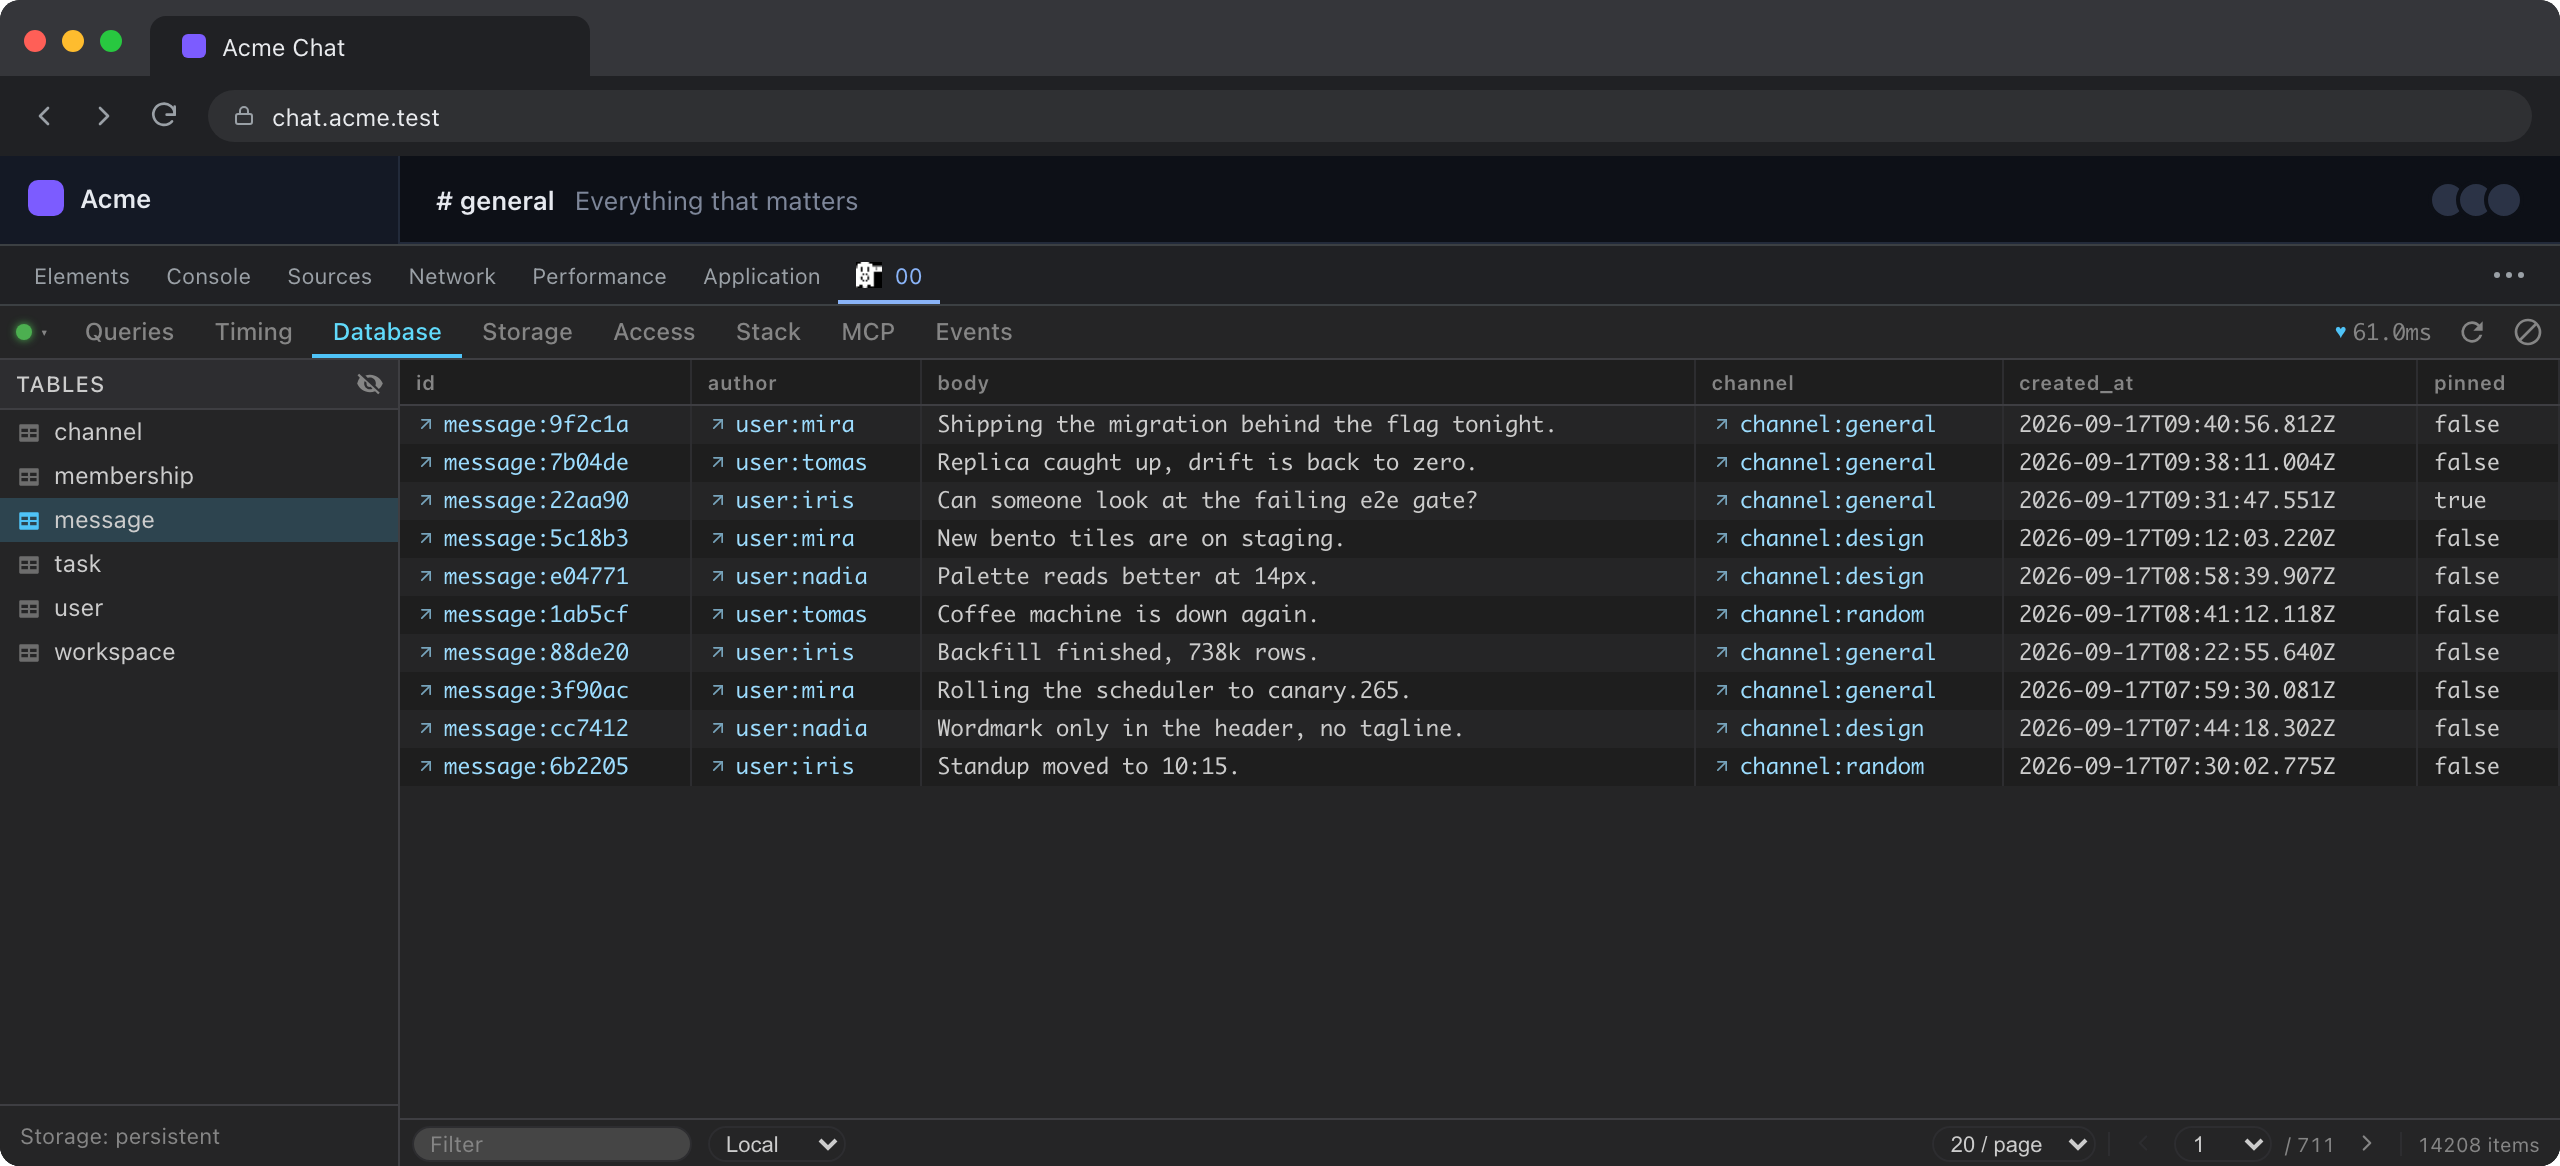
Rows are paginated, filterable, and editable in place; the row inspector shows
one record as JSON, ready to copy. Internal _00_* sync tables are hidden behind
the eye toggle, which remembers what you chose. The footer under the table list
reports whether the local store is really persistent and, when tabs are shared,
which role this one has.
The local store is SQLite when the SQLite engine is enabled, and it speaks only a subset of SurrealQL. A statement it cannot translate fails with an explanation and a pointer to run the same query against Remote instead.
Storage
What the local cache actually is, and whether it is as durable as it claims.
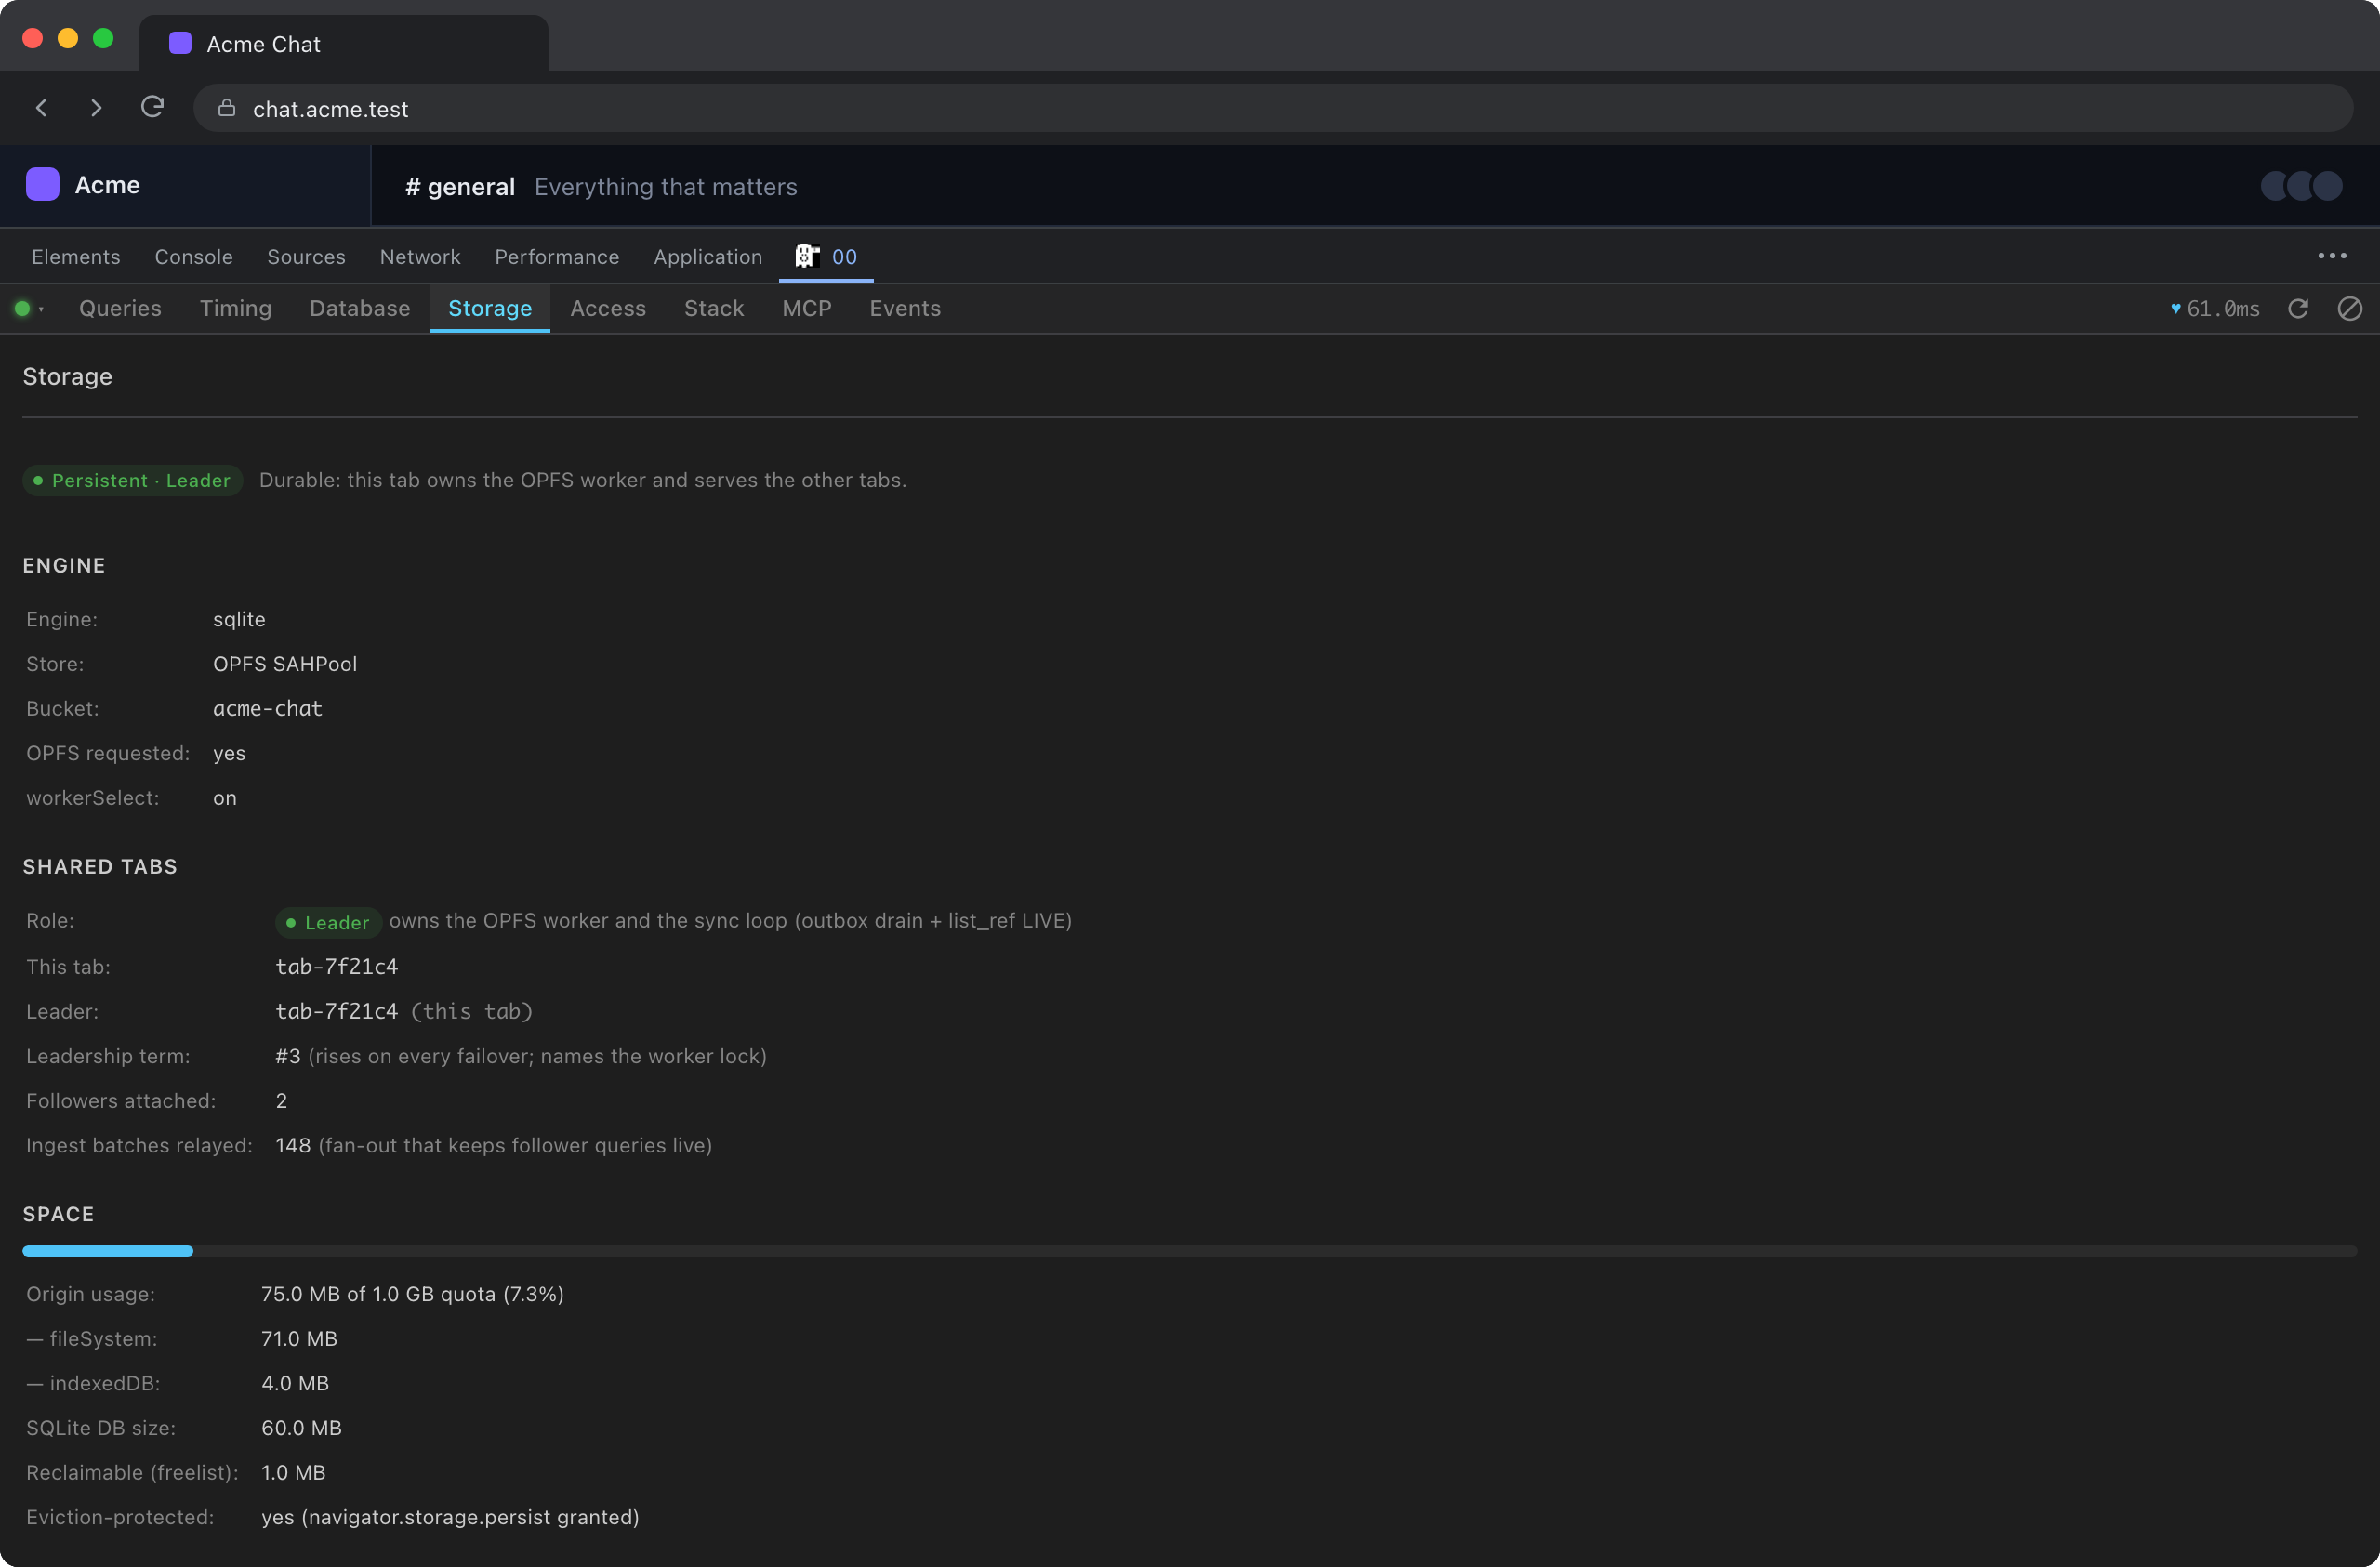
The top of the tab answers the questions that are invisible from the outside:
which engine and store are running, whether OPFS was requested and granted,
whether workerSelect is really in effect or was downgraded at runtime, and,
when sharedTabs is on, whether this tab owns the store or follows another
one, with the leadership term and the number of batches it has relayed.
A store that asked to be persistent and silently fell back to memory is called out here rather than discovered after a reload loses writes.
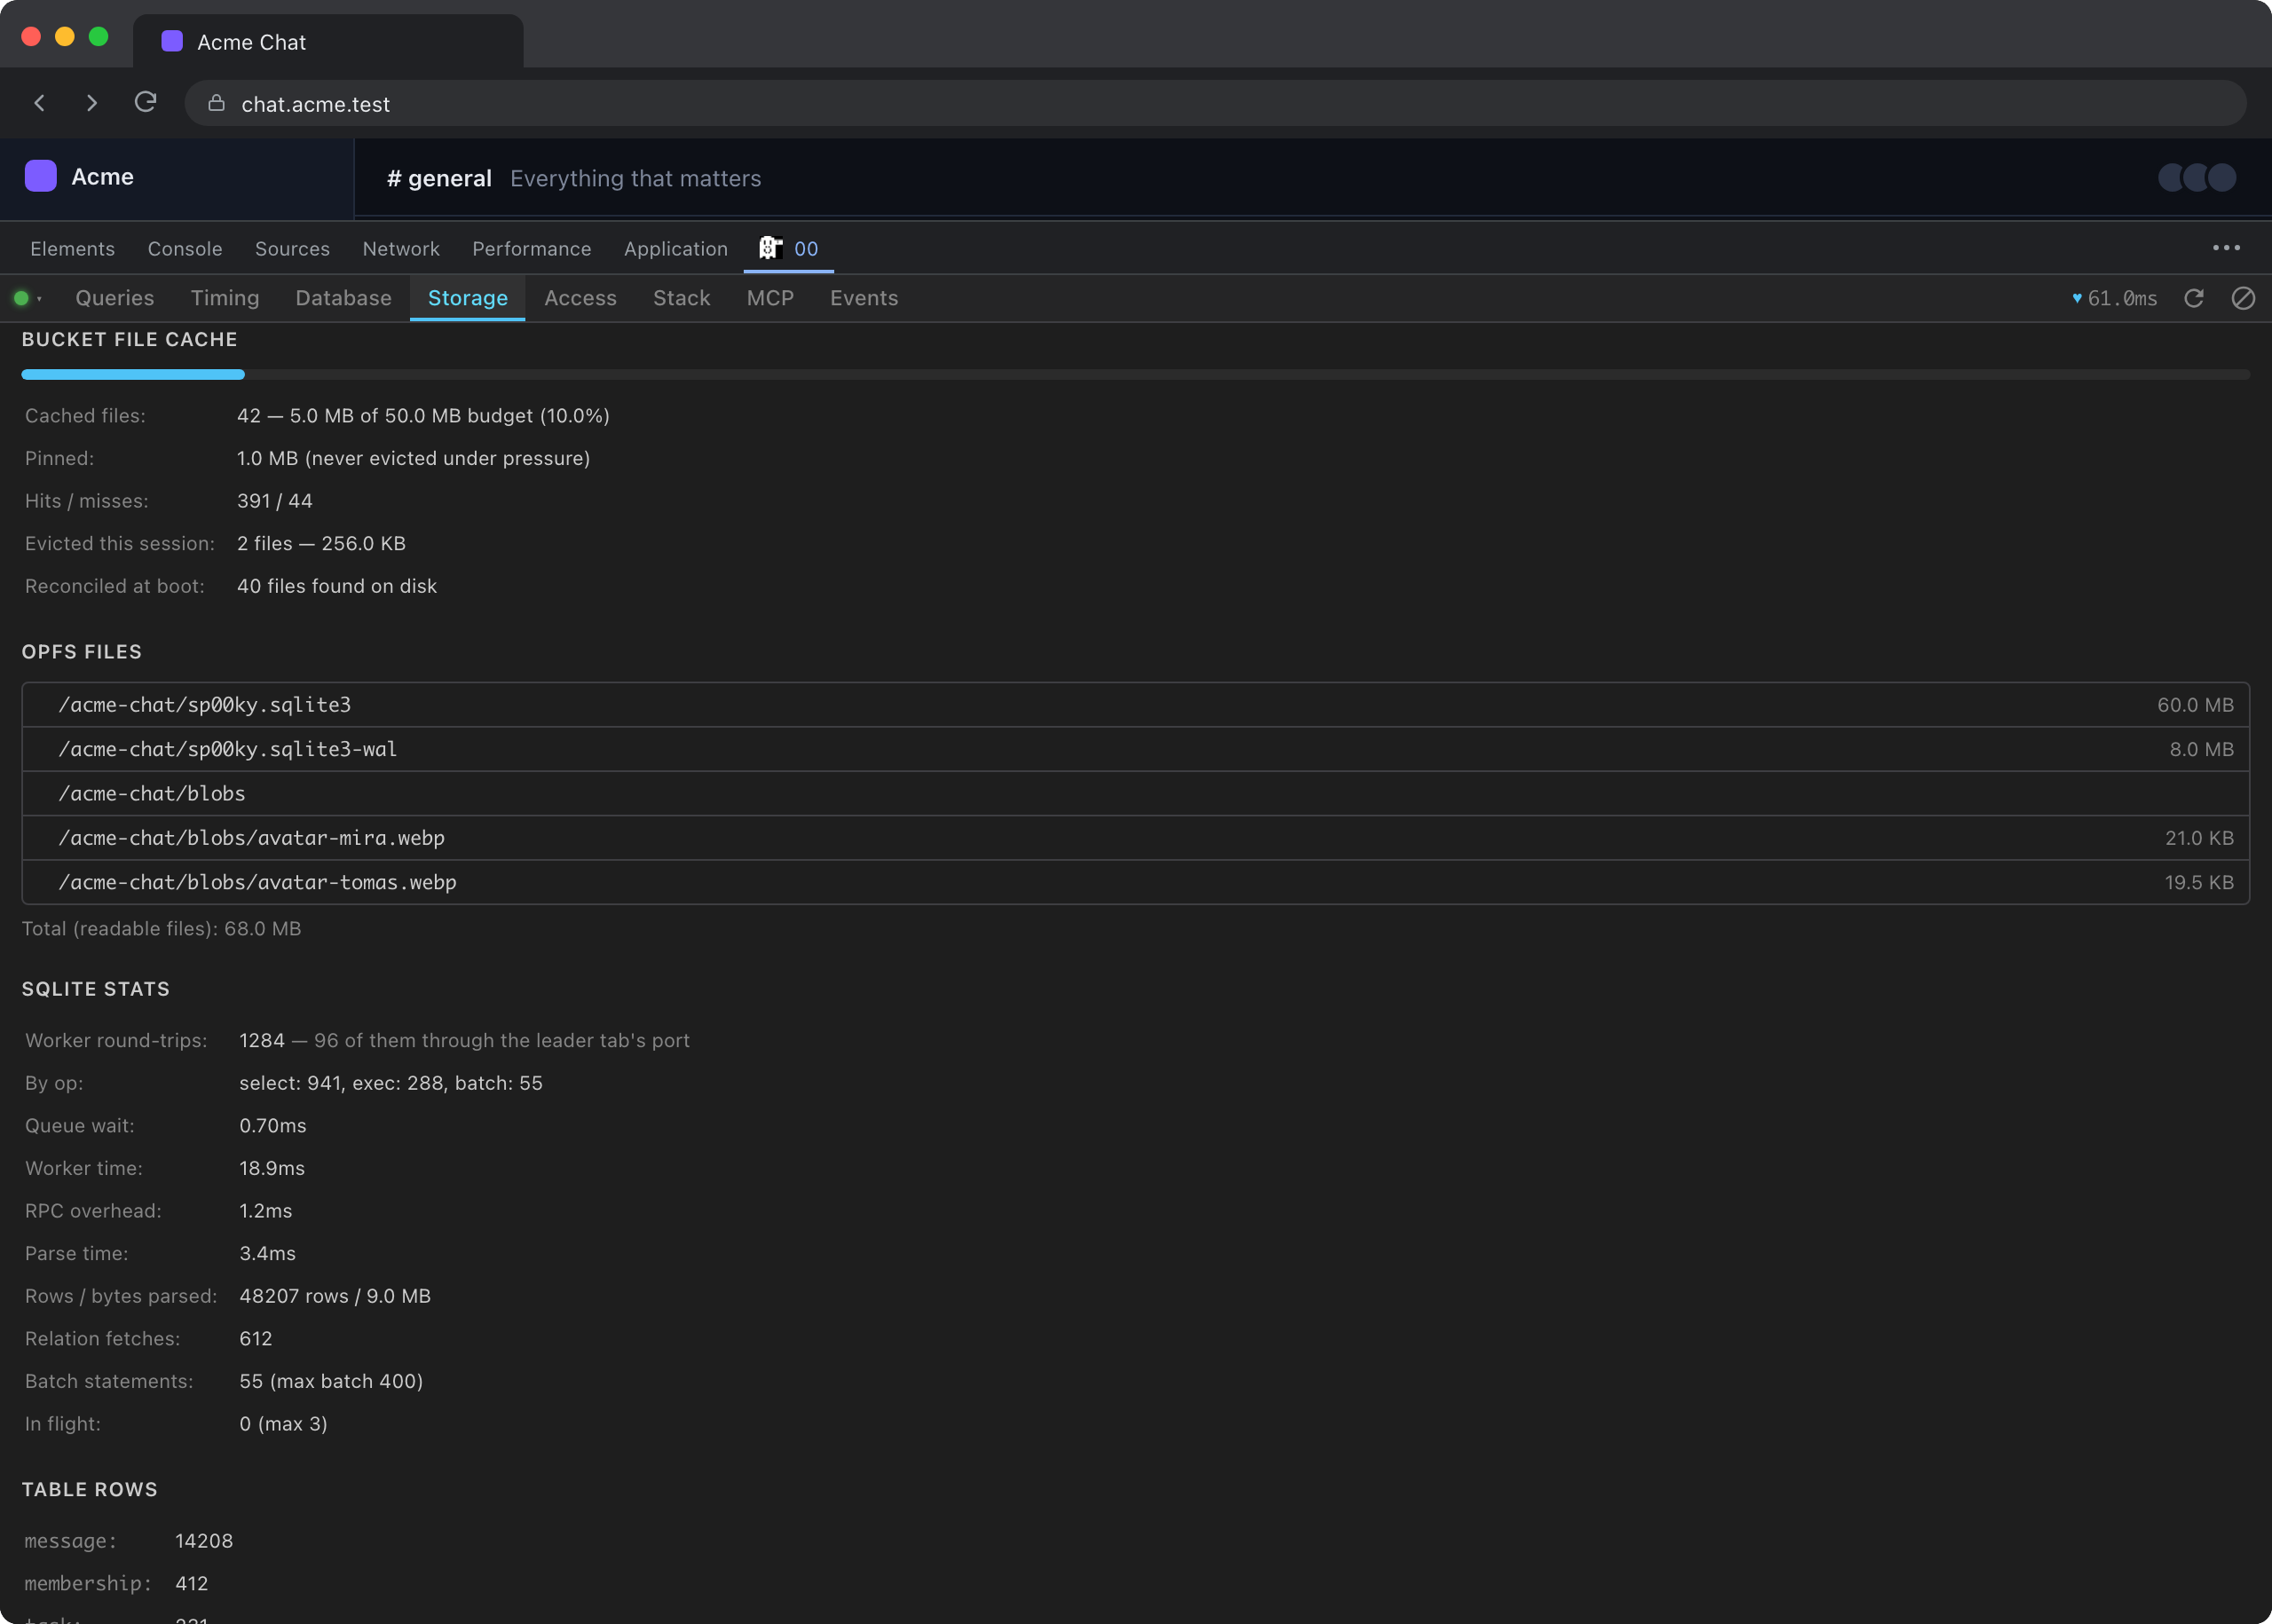
Below that: the bucket file cache with its budget, hit and eviction counters; every OPFS file with its size; SQLite worker statistics (round trips, queue wait, parse time, batch sizes); and a per-table row count.
Access
Identity and what that identity is allowed to see, in one place.
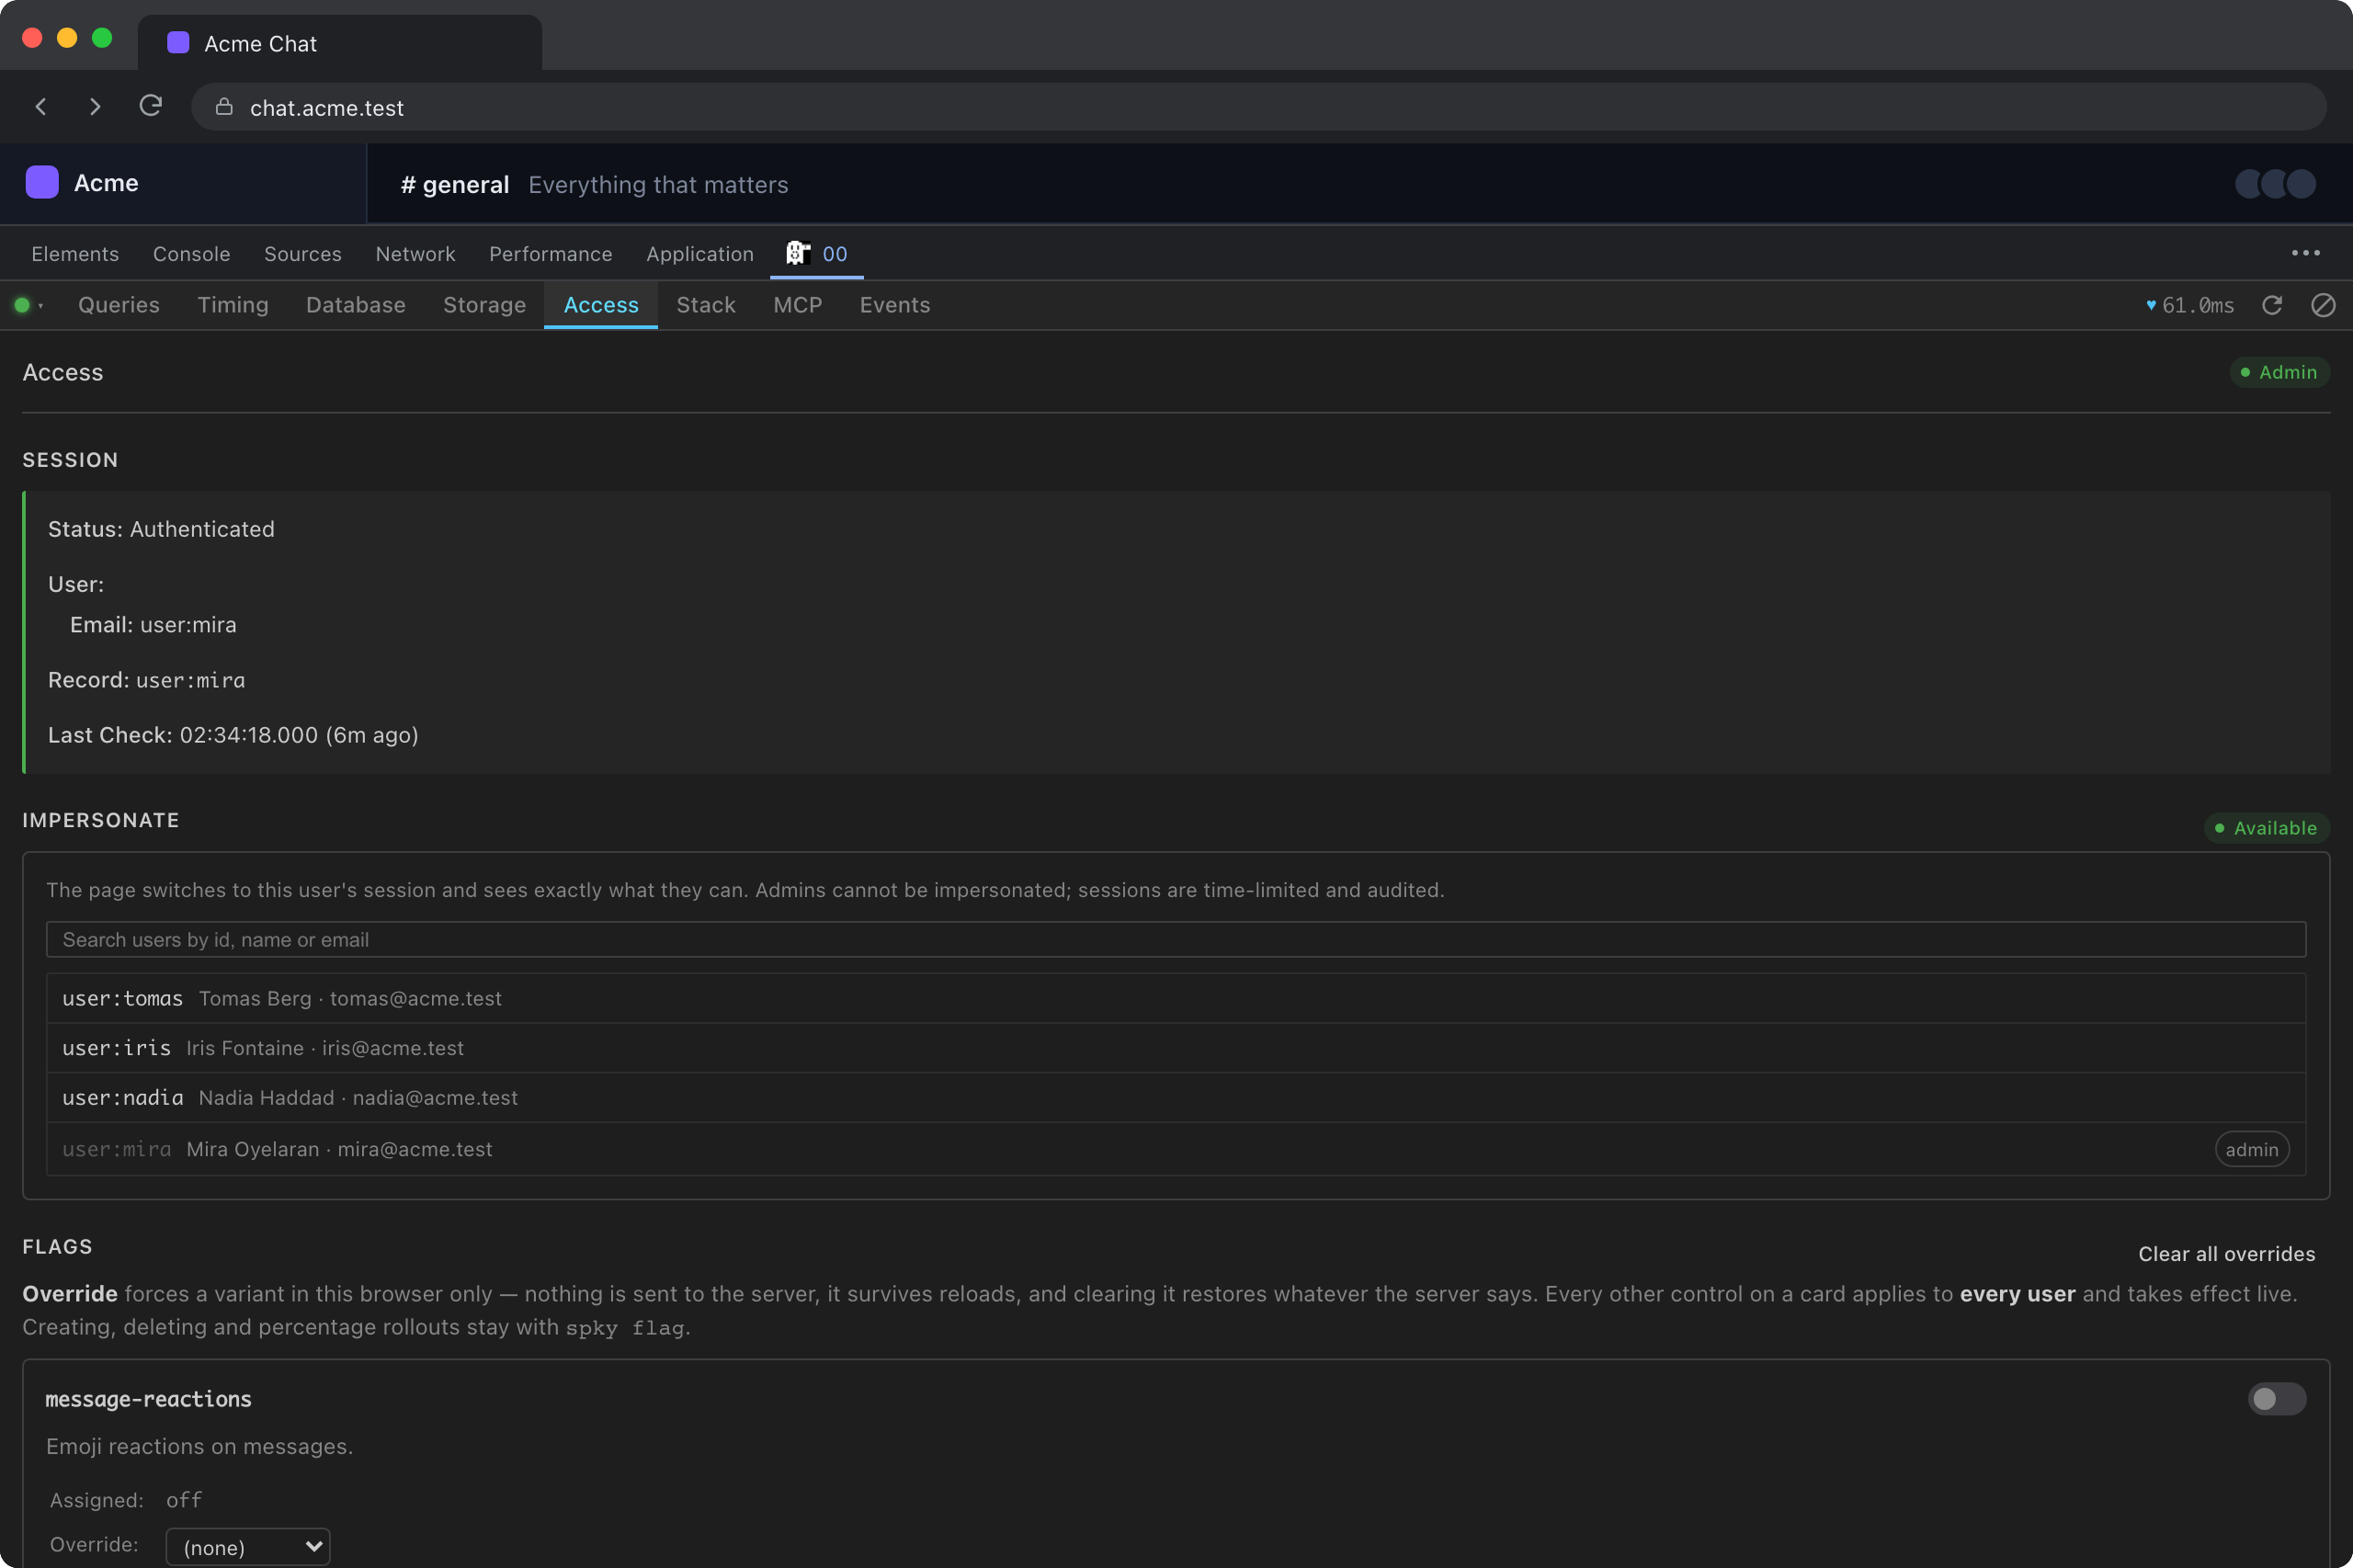
Session is the signed-in user, their roles and the record id, the same id
that spky admin add takes.
Impersonate starts and stops an admin impersonation from the panel. The page switches to the target’s session and sees exactly what they can. Admins cannot be impersonated, a reason is required and kept in the audit log, and sessions are time-limited. The section explains itself when the feature is off for the project or the signed-in user is not an admin. See admin impersonation.
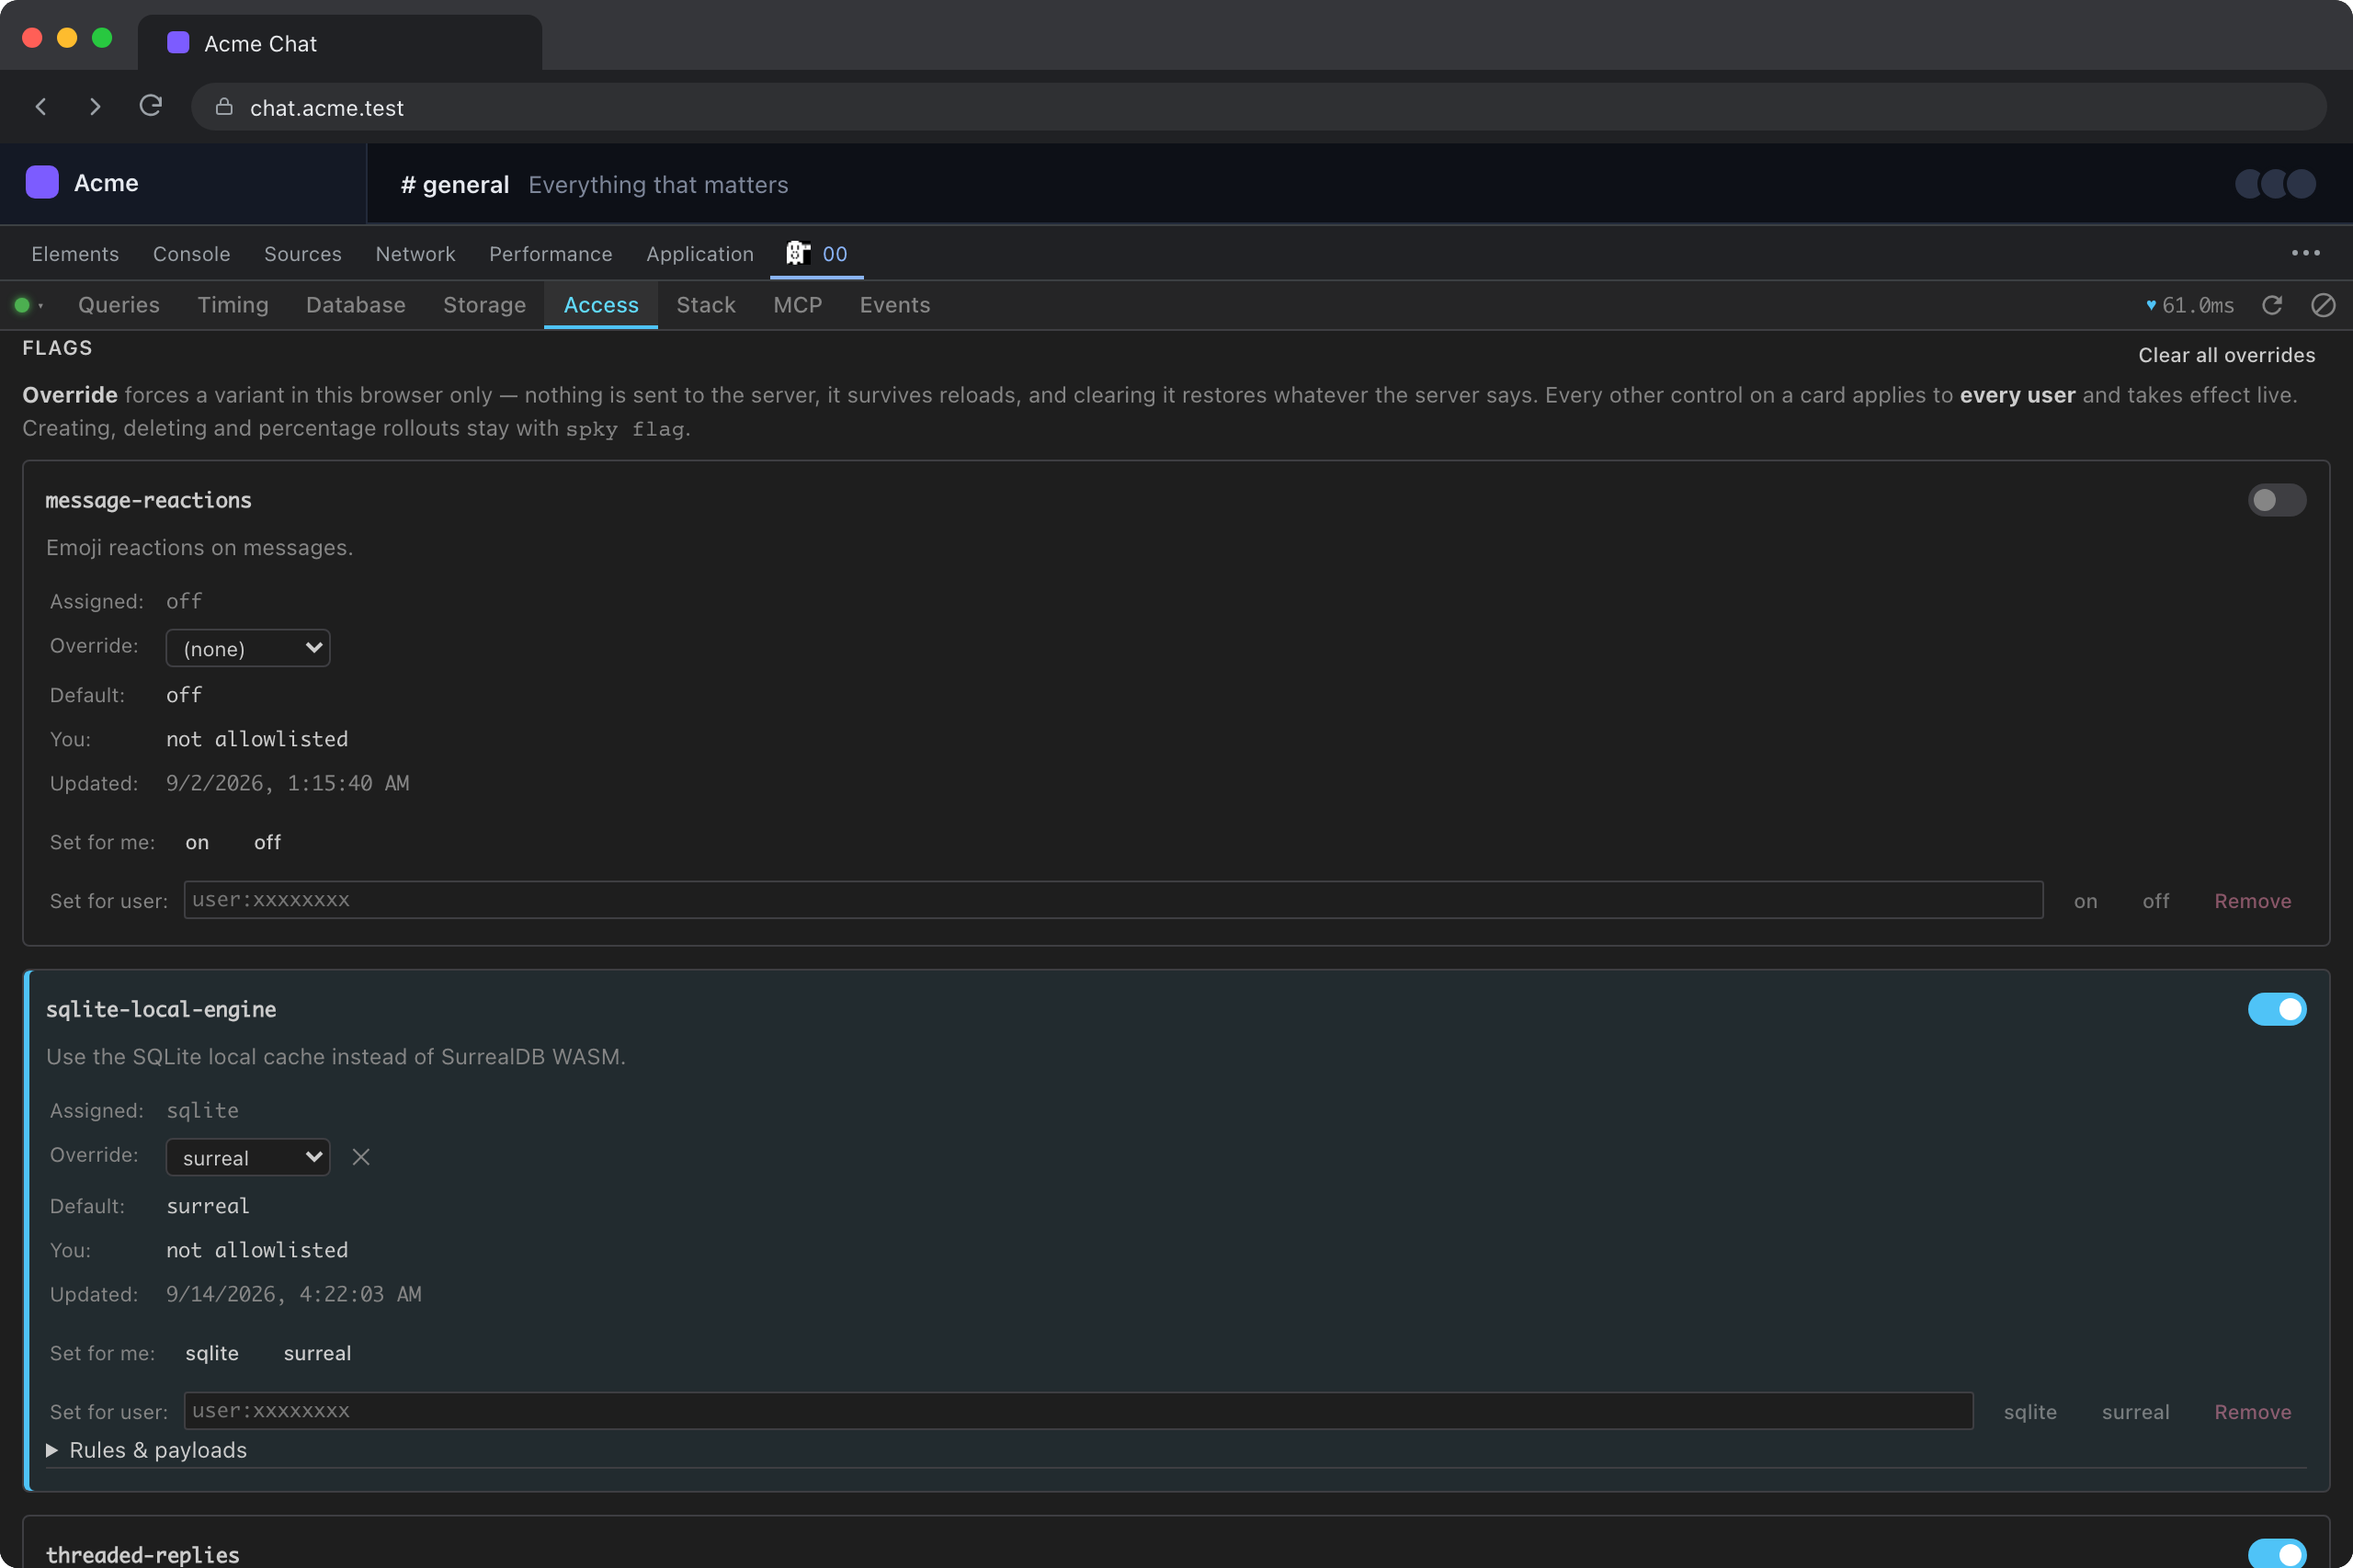
Flags lists every flag the client has seen, with its assigned variant, its default, its rules, and whether you are allowlisted. Two kinds of control live on each card, and they are deliberately not the same thing:
- Override forces a variant in this browser only. Nothing is sent to the server, it survives reloads, and clearing it restores whatever the server says.
- Everything else, enabling a flag or allowlisting yourself or another user, applies to every user and takes effect live.
Creating flags, deleting them and percentage rollouts stay with
spky flag.
Stack
Which versions are actually running, on both sides of the connection.
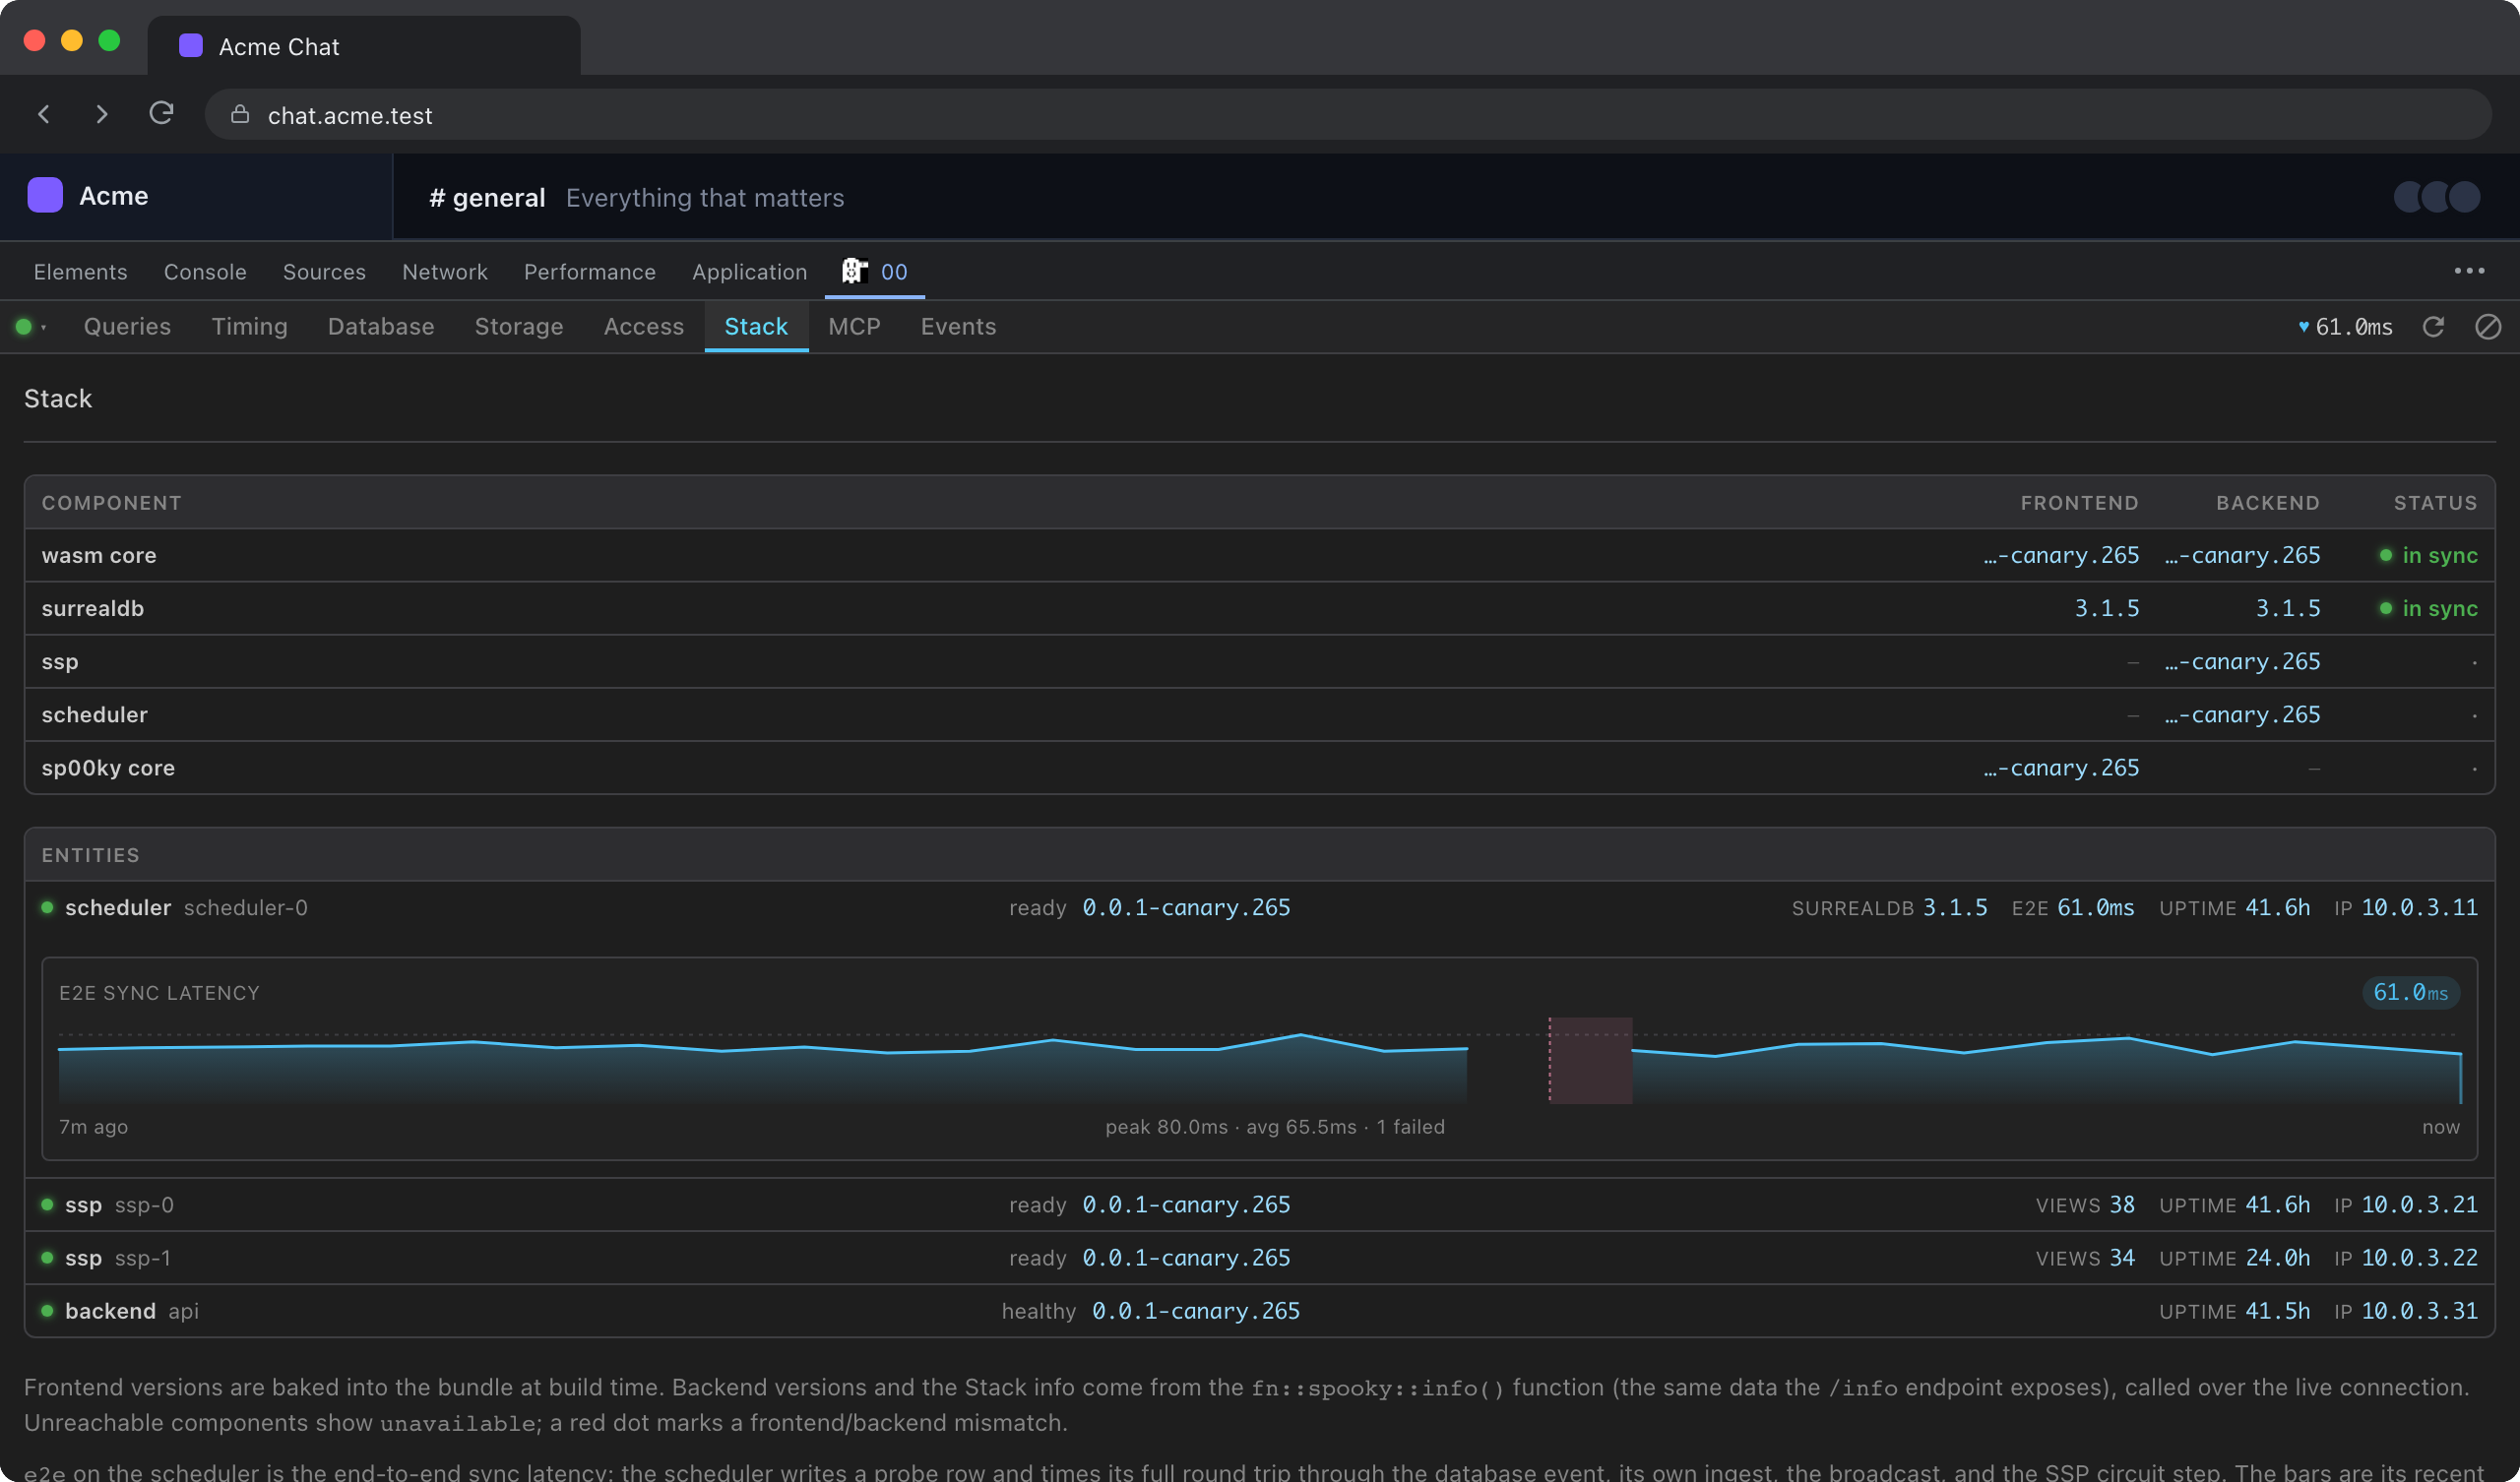
Frontend versions are baked into your bundle at build time; backend versions and
the entity list come from fn::spooky::info() over the live connection. Rows
that describe the same artifact on both sides are compared, so a client running
a different build from its SSPs reads as drift instead of as two numbers you
have to diff yourself.
Underneath, every entity in the deployment (each SSP, the scheduler, your
backends) with its status, version, view count, uptime and address, plus the
scheduler’s end-to-end latency history. A gap in that chart means not probed,
never 0ms.
MCP
The panel can hand the same state to an AI assistant.
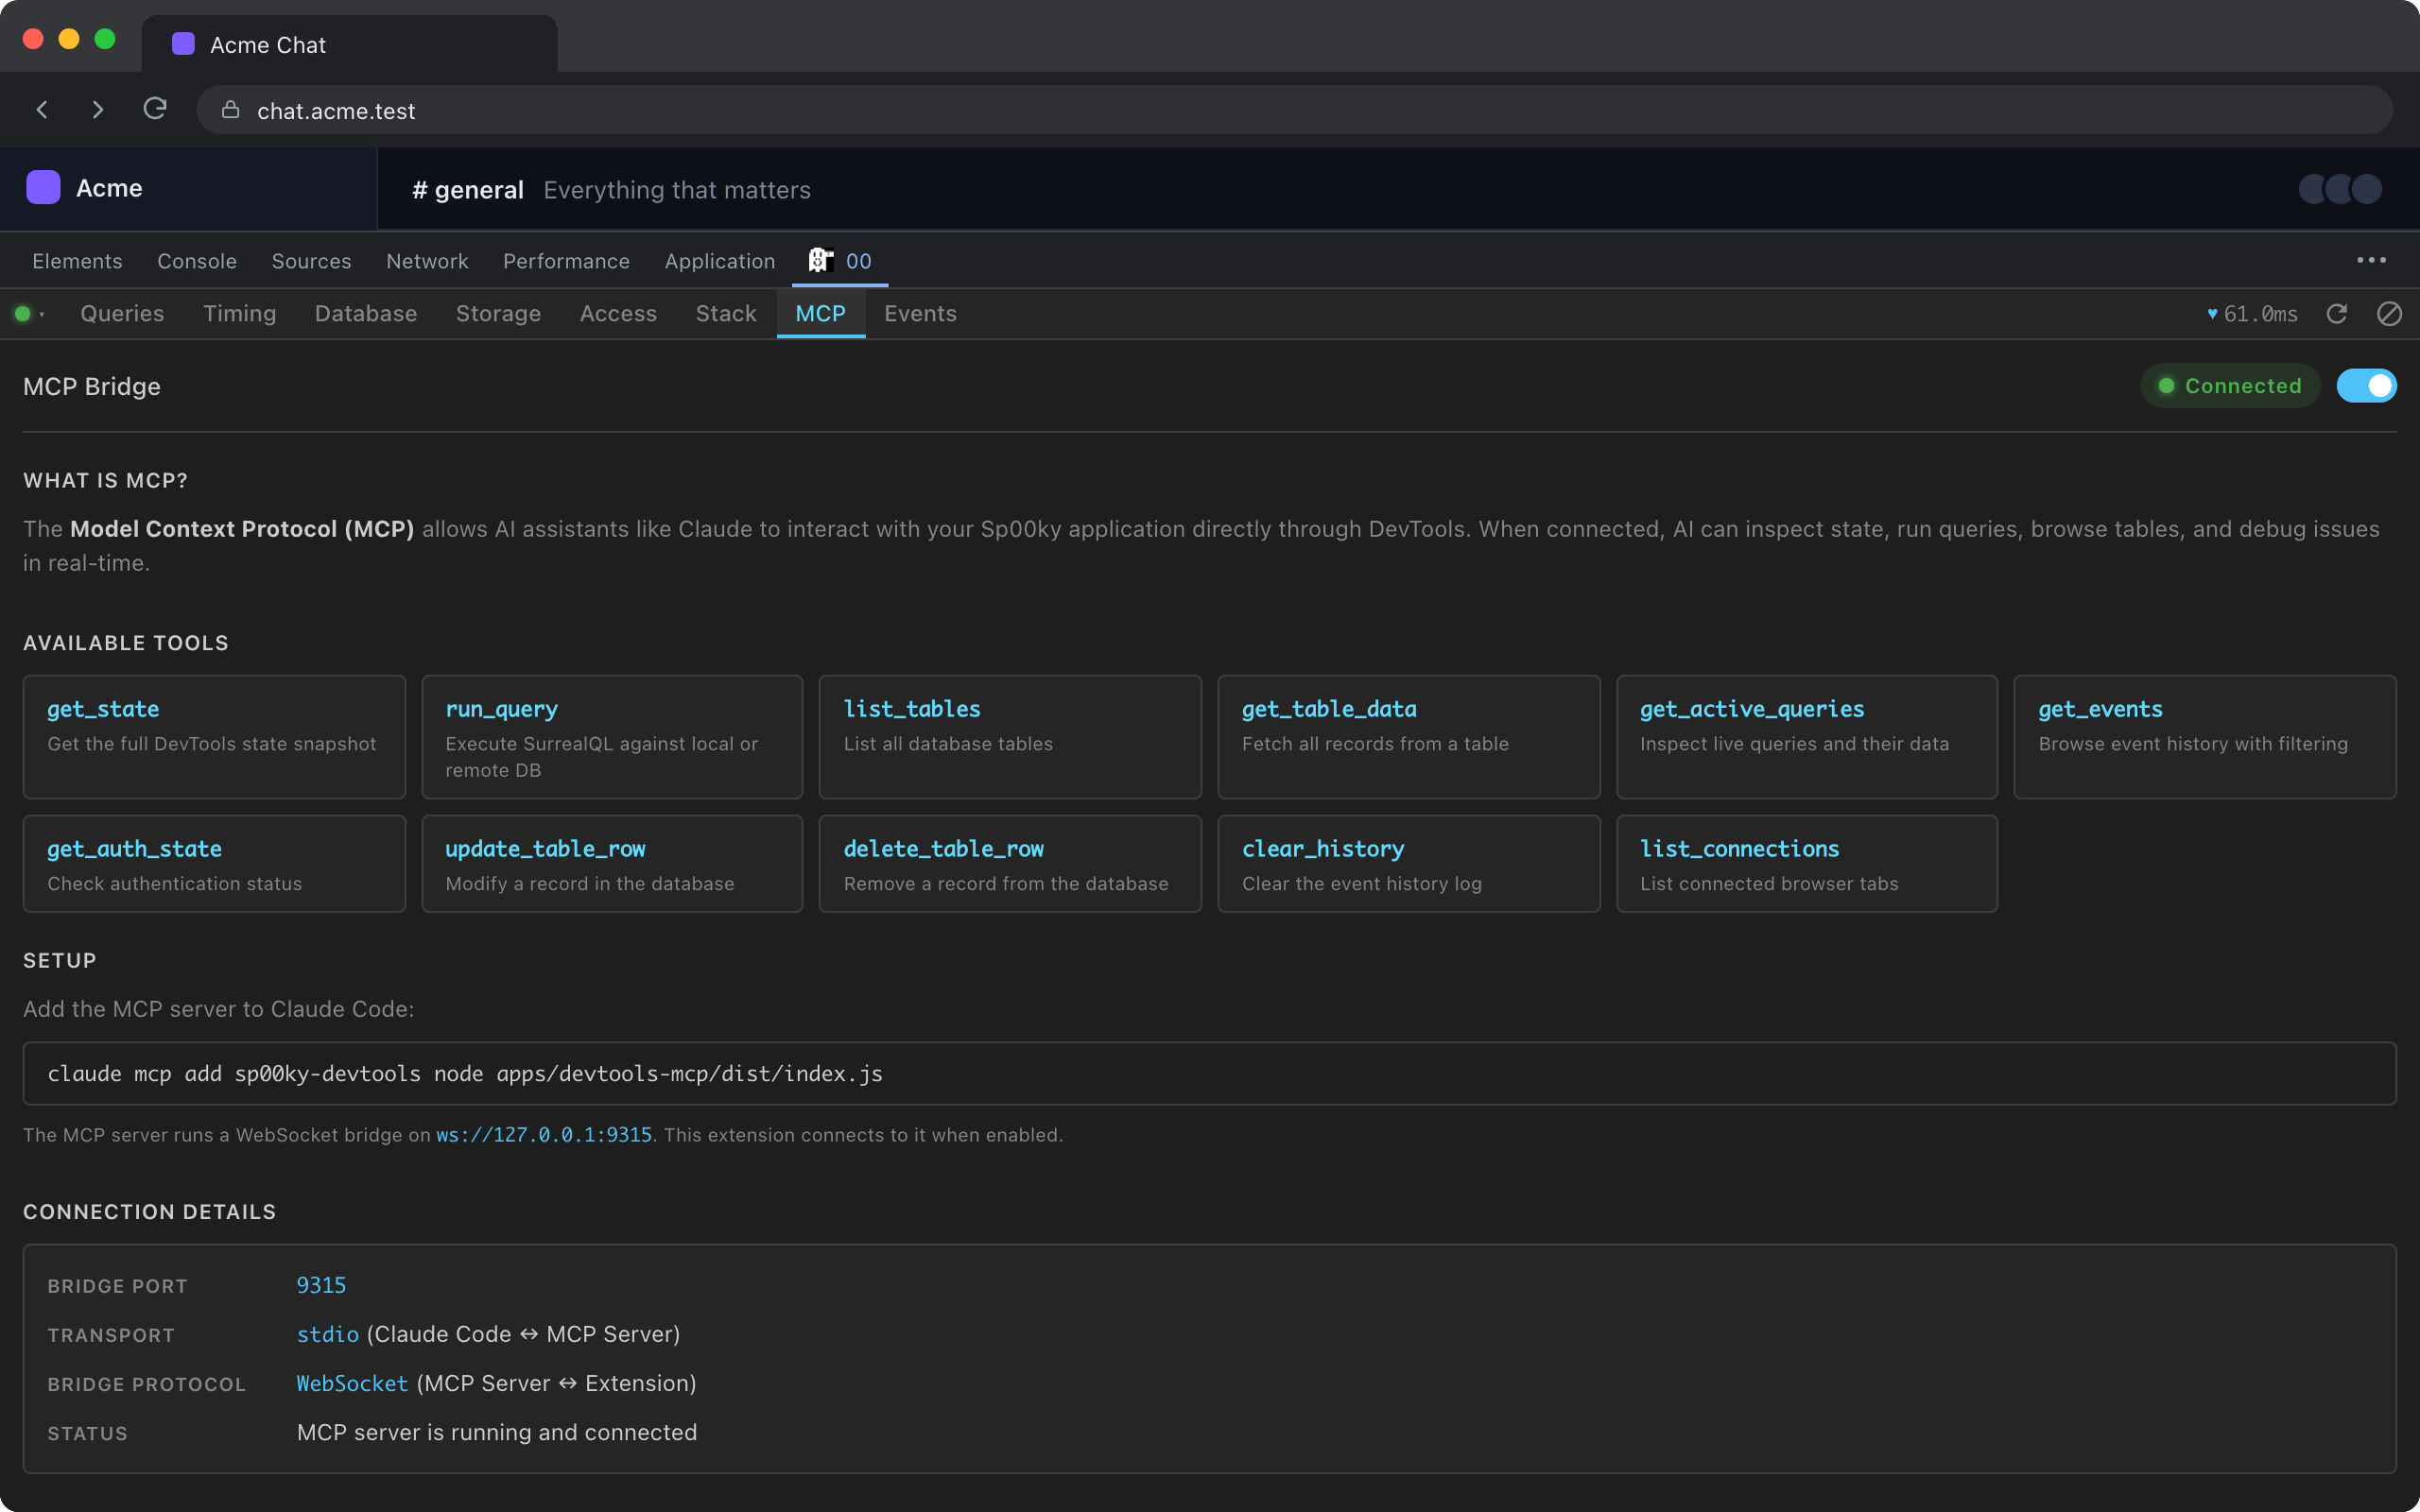
With the bridge enabled, @spooky-sync/devtools-mcp
connects over a local WebSocket and exposes the tab’s state as MCP tools:
get_state, run_query, list_tables, get_table_data, get_active_queries,
get_events, get_auth_state, update_table_row, delete_table_row,
clear_history and list_connections. The assistant then sees the exact
state your tab has, the same local cache, the same live queries, the same auth,
rather than a fresh connection to the database.
The toggle is off by default; nothing listens until you turn it on.
Events
The client’s event log, newest first, with each payload expanded.
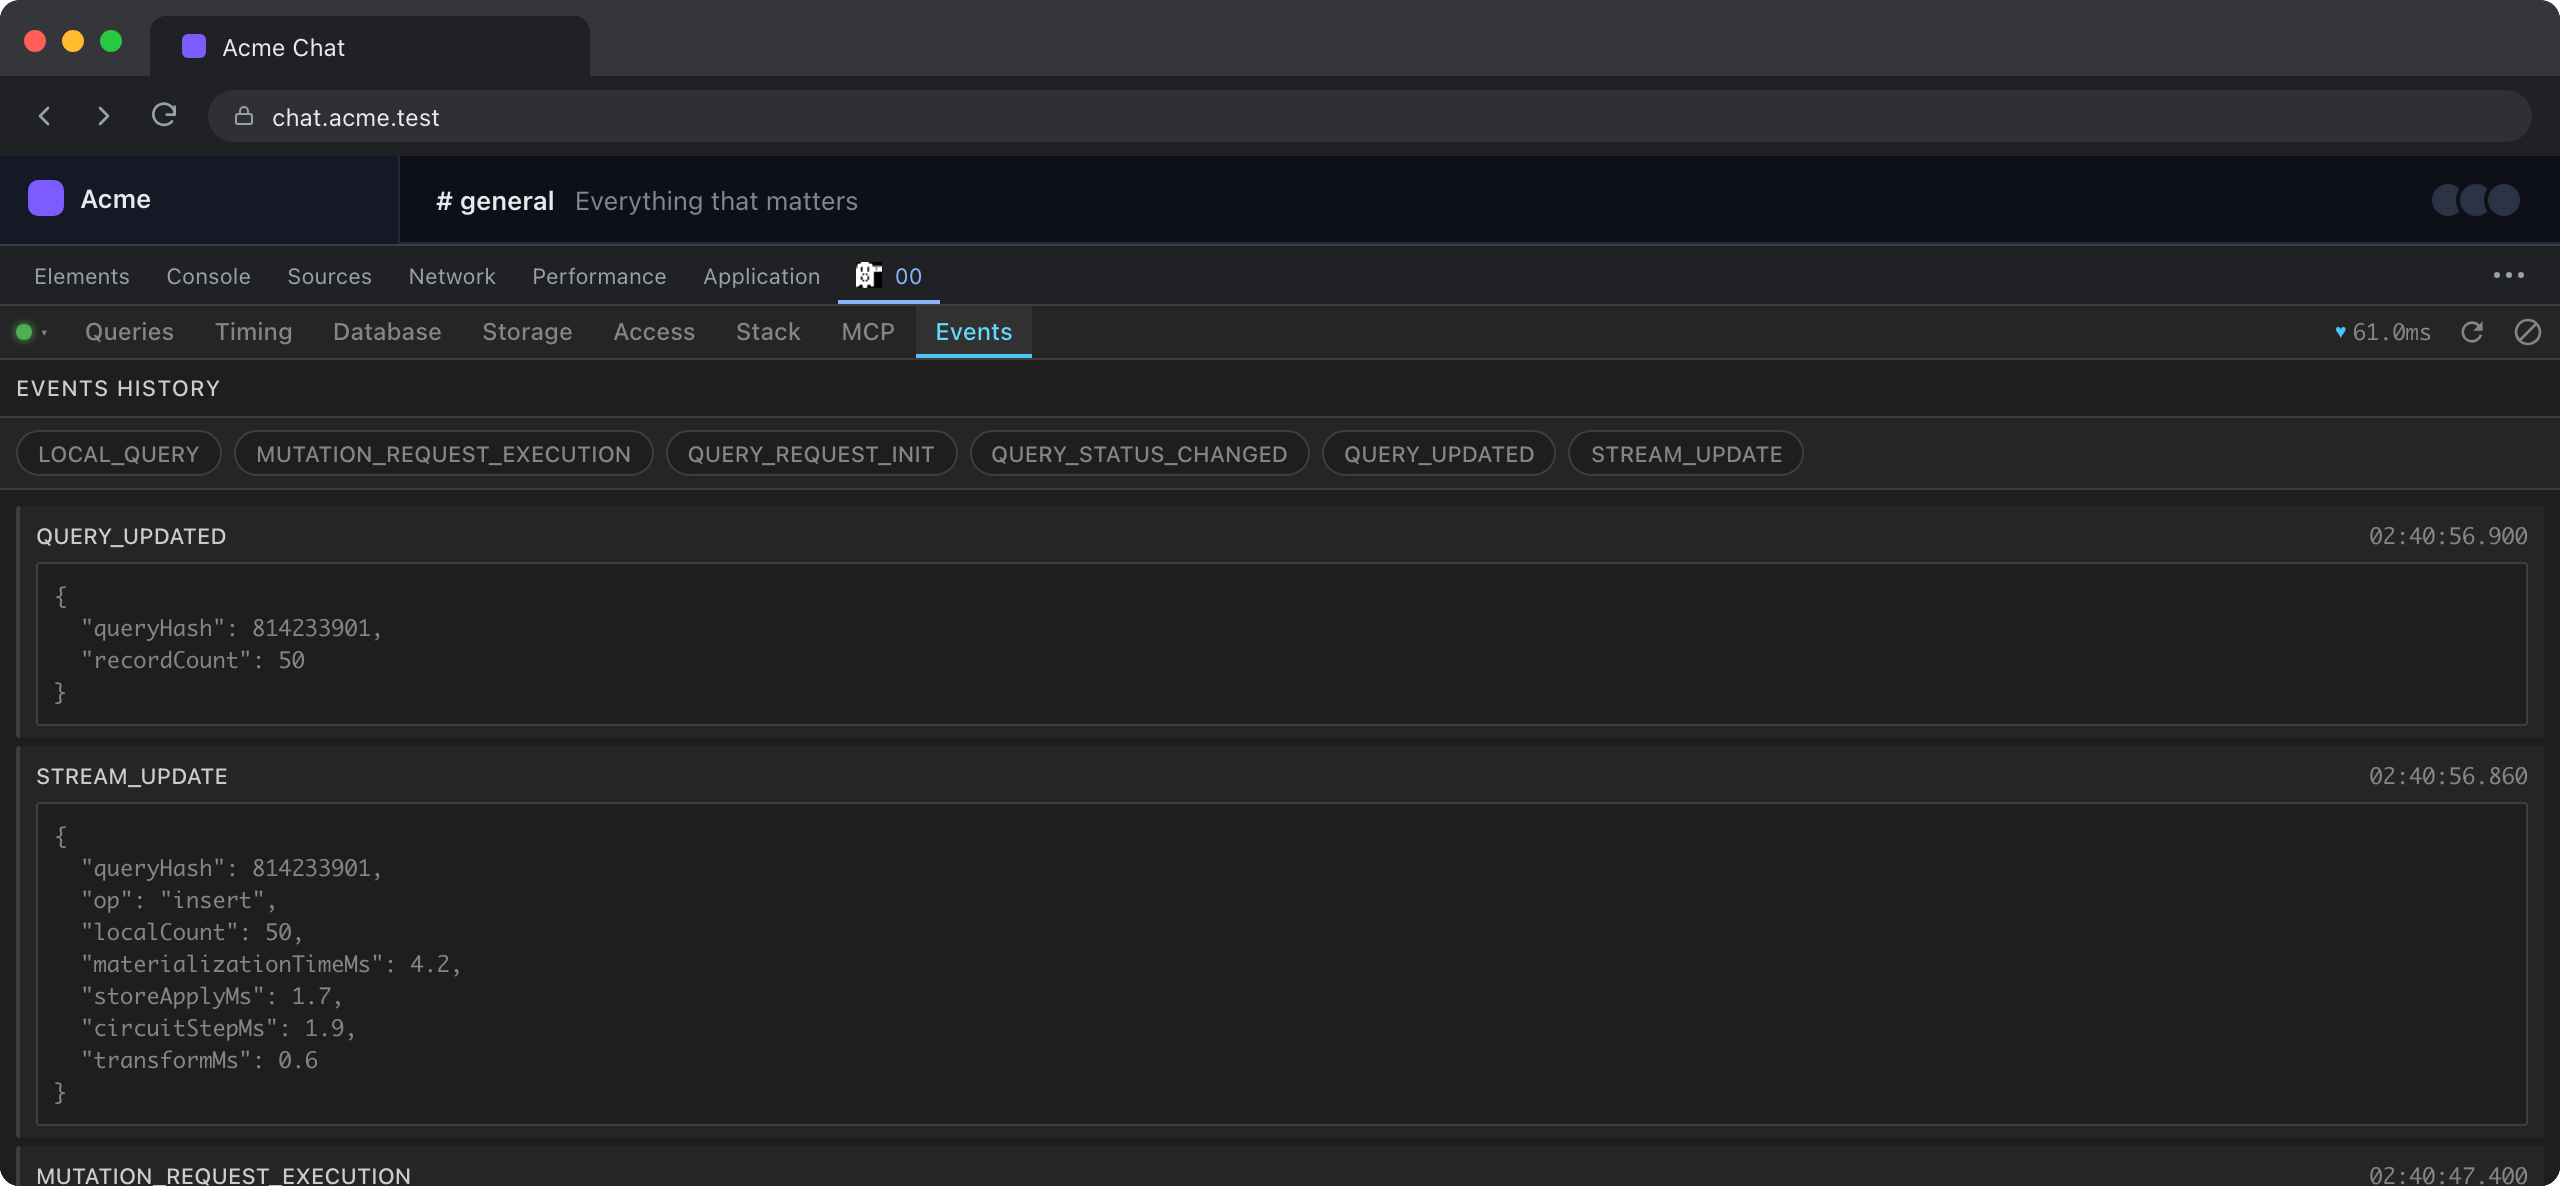
The chips along the top are the event types present in the log; click them to
filter. QUERY_REQUEST_INIT and QUERY_UPDATED bracket a query’s life,
STREAM_UPDATE carries the per-phase materialization timings of a single
ingest, MUTATION_REQUEST_EXECUTION records a write leaving the client, and
LOCAL_QUERY / REMOTE_QUERY are the statements each store actually ran.
What it changes
Most of the panel only reads. The exceptions are explicit, and worth knowing before you use them against something that matters:
| Action | Scope |
|---|---|
| Editing or deleting a row on Database | Writes to the selected source, local or remote. |
| Flag Override | This browser only. Never sent to the server. |
| Flag enable / allowlist | Every user, live. |
| Start / stop impersonation | The page’s session, audited and time-limited. |
| MCP bridge | Off until enabled; grants an assistant the tools listed above. |
Regenerating these screenshots
They are captured from the real panel driven by a fixed fixture, not by hand:
See apps/devtools/screenshots/README.md for what to update when a tab is added
or a state shape changes.