
Admin dashboard
The operator dashboard the scheduler serves at /admin: sign-in, cluster overview, restart and backup actions, backend health, live logs and workflow runs.
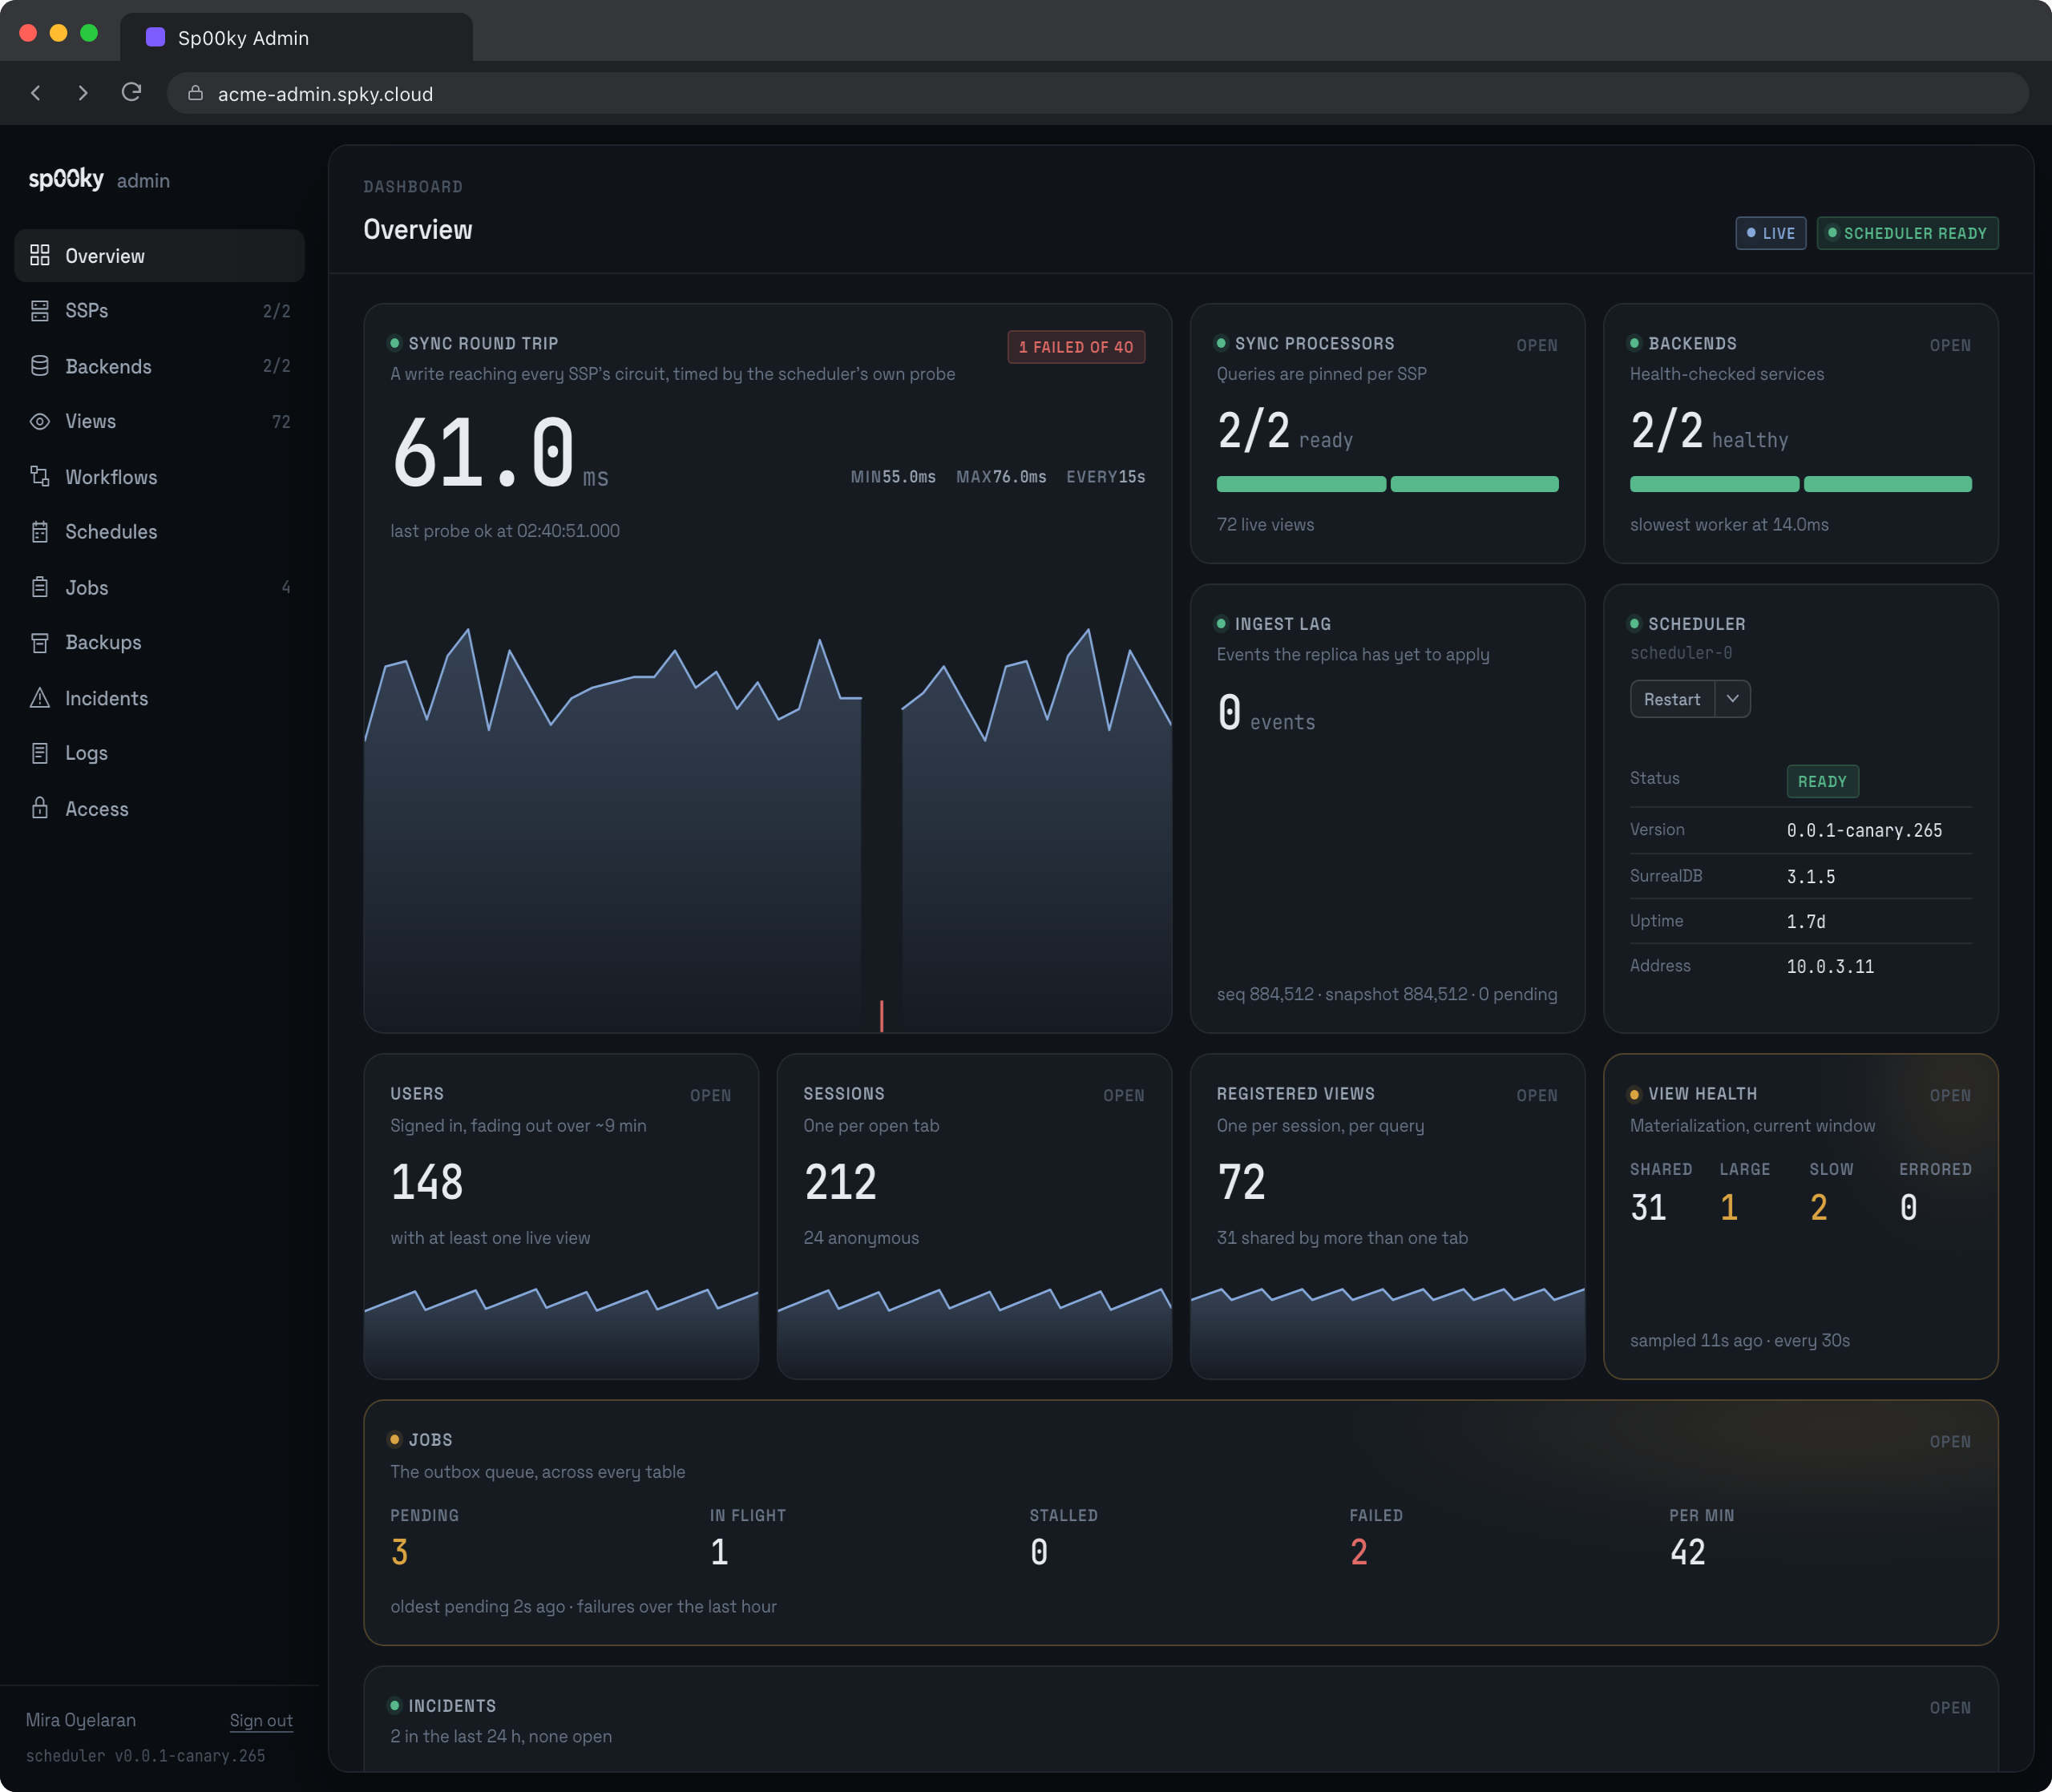
Every scheduler serves an operator dashboard. It shows the health of the scheduler and its SSPs, the end-to-end sync latency, the status of your backends, live logs, and workflow runs as they happen.
Incident history
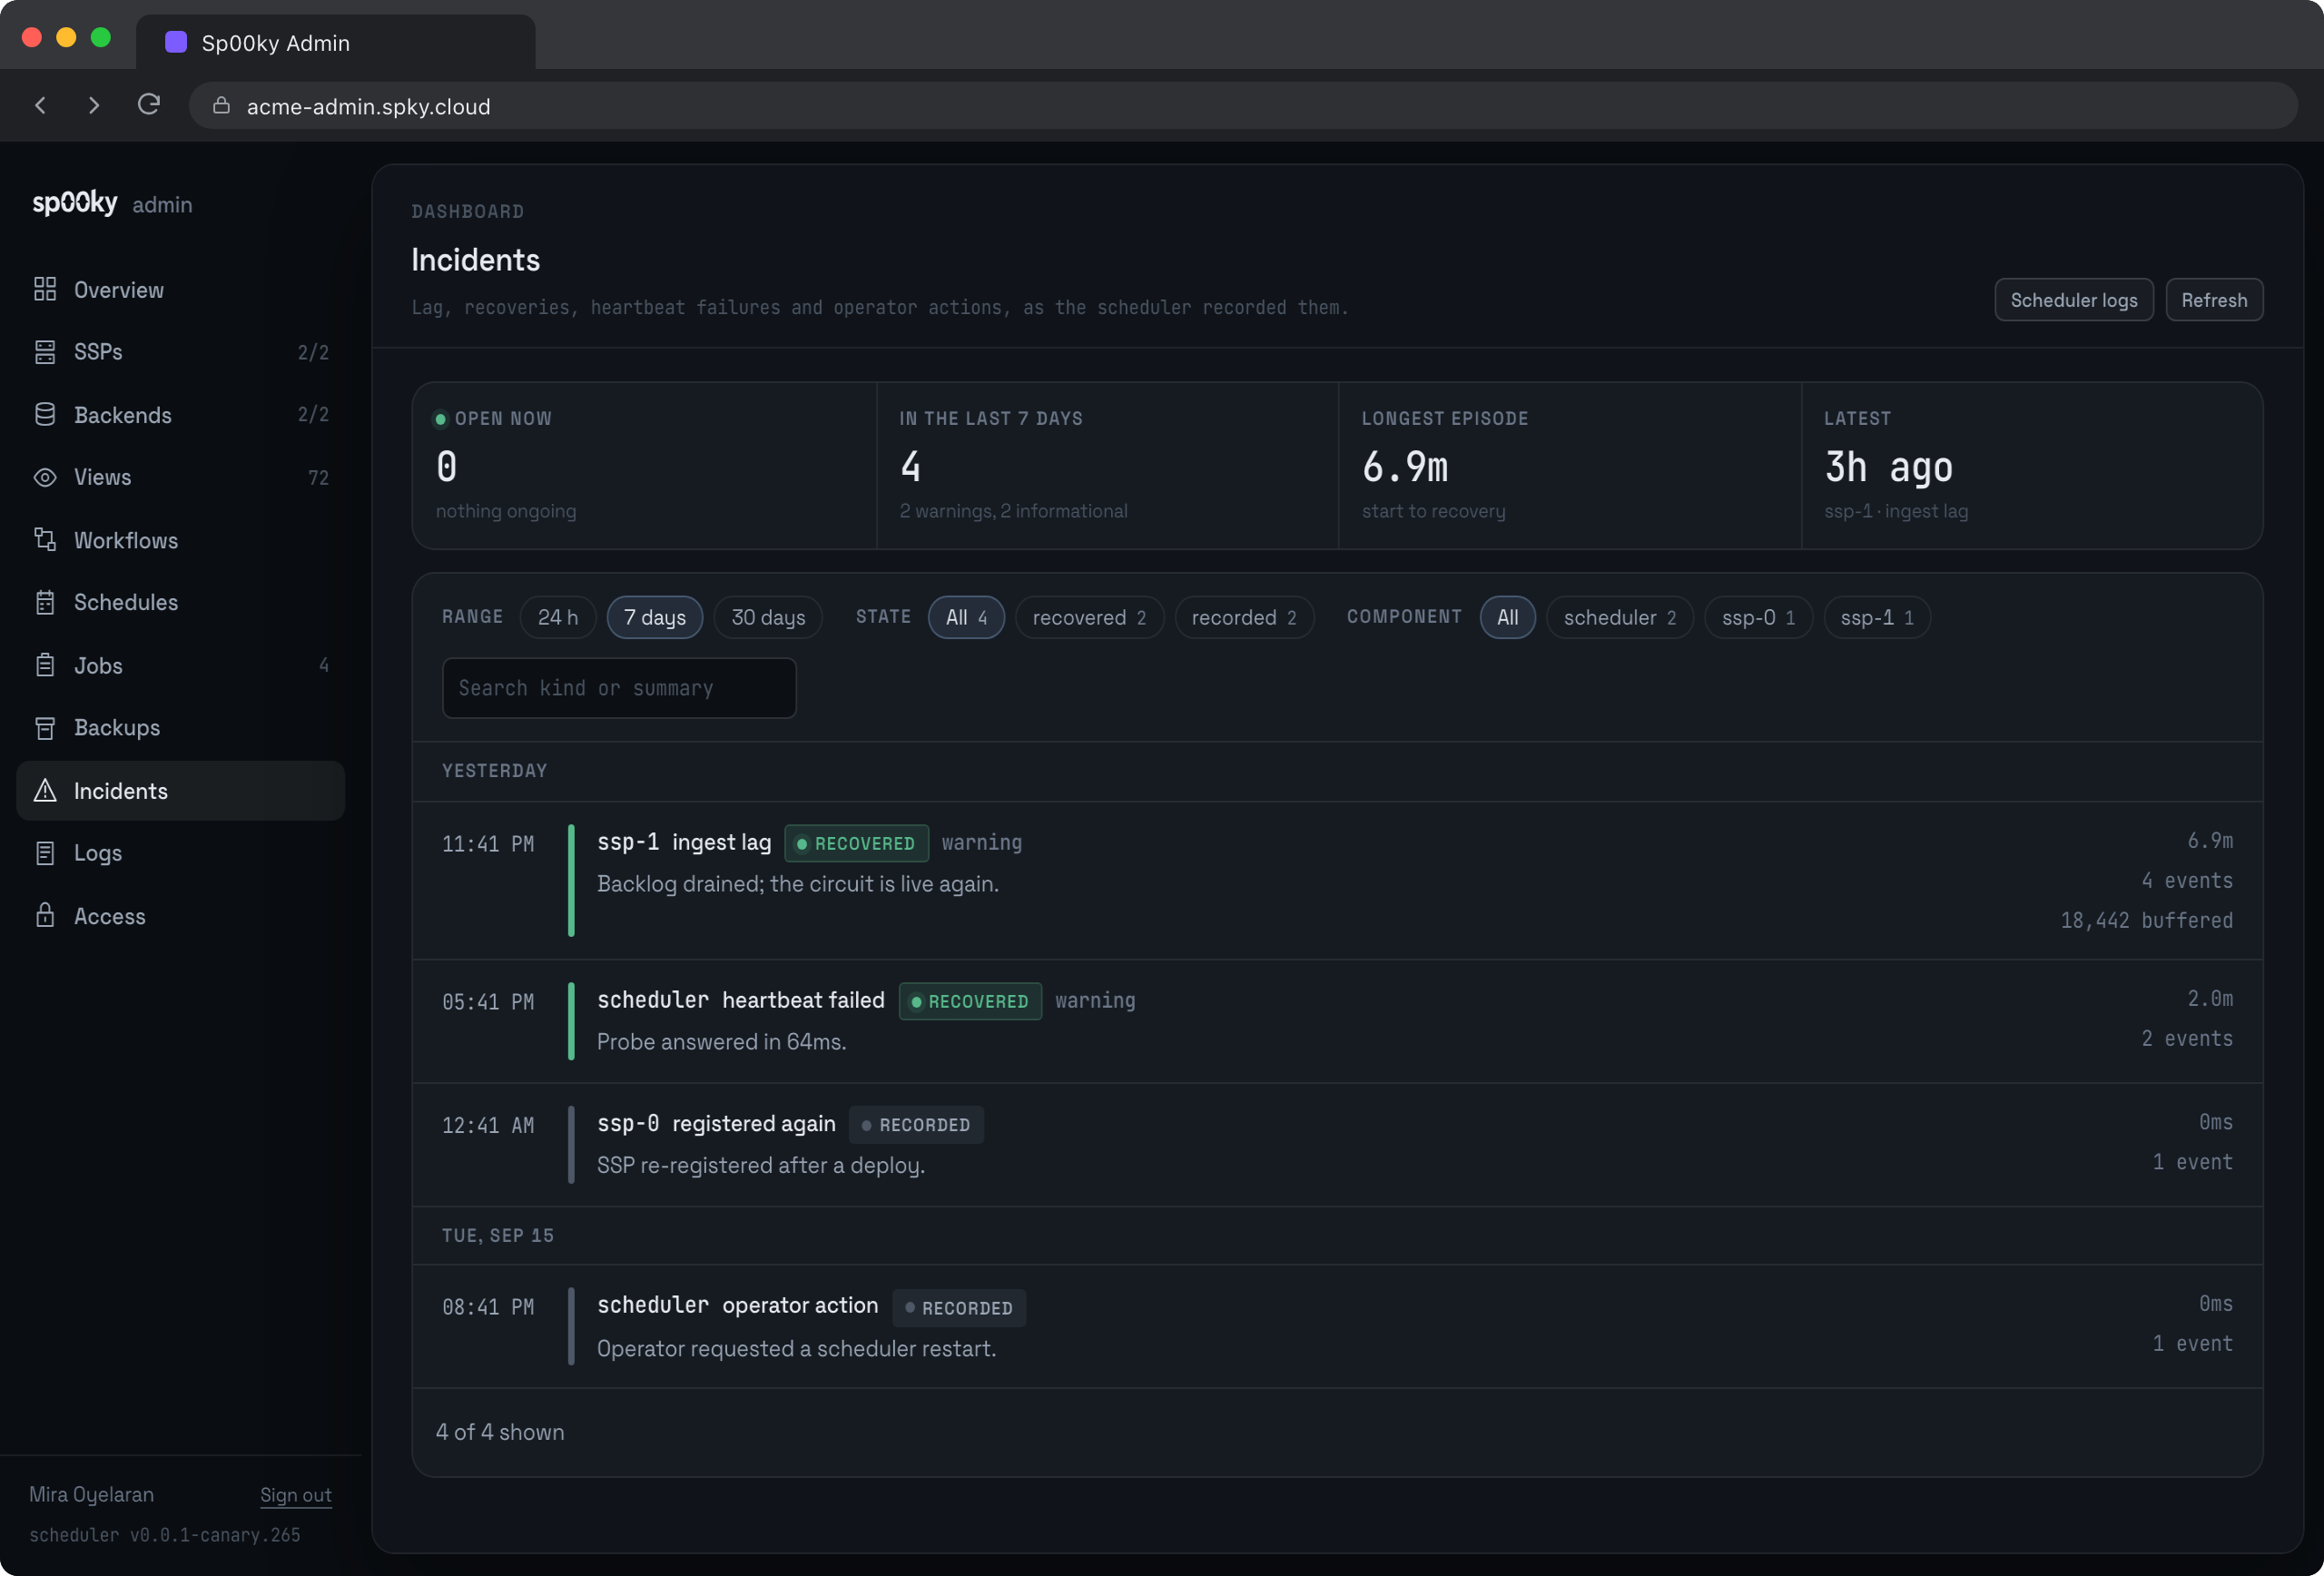
The Incidents navigation item keeps automatic lag, heartbeat failures, bootstrap integrity failures, removal/re-registration, recovery, and operator actions in one timeline. Every navigation entry has a labeled icon on desktop and mobile. The overview carries an Incidents tile: the open count, the last 24 hours as a strip with one marker per episode (as wide as it lasted, pulsing while open), and a link to the latest one.
The page opens on a rail (open now, count in the range, longest episode, latest) above a day-grouped feed. Filters are chips that apply the moment they are clicked: range (24 h, 7 days, 30 days), state and component, each with its count, plus a search over kind and summary. The chips filter the newest 400 episodes of the range on the client, so switching between them costs no request. Open an incident to see its duration, largest sampled event backlog, server version, operation id when present, and event timeline. Recovered means the scheduler observed recovery. Interrupted means the scheduler restarted before it could observe recovery. Lag followed by replay is described separately from an SSP re-registering; re-registration alone does not prove a container crash.
History is stored in incidents.json beside the scheduler WAL, independently
of SurrealDB. Keep that directory on persistent storage. Retention is bounded
by 30 days, 2,000 incidents, 64 events per incident (first and newest retained),
and an 8 MiB file cap. Counts include compacted events. Ordinary events flush
once per second; a scheduler restart or cloud restart request flushes its action
before exit/dispatch. Abrupt termination can lose the last unflushed second.
A clean restart that wipes the scheduler volume also wipes its incident history.
A missing or unreadable history file is reported in the dashboard; malformed
history is not overwritten. The incident logging target stays enabled even
with RUST_LOG=warn. A dropped log-feed segment becomes a visible history-gap
record. Stored summaries contain no query bindings, SQL, or credentials.
Detailed logs remain available through the Logs page and are independently
subject to their retention limits. History starts when this version is deployed;
it does not reconstruct older incidents from arbitrary log text.
The read-only MCP tools incidents_list and incident_get expose the same
history as the dashboard. See the scheduler API.
Opening it
The dashboard is bundled into the official mono424/spooky-scheduler image and
served on its own port:
http://<scheduler-host>:9668/adminWhy a second port
Everything on the ingest port (9667) is unauthenticated by design — including
POST /proxy/query, which runs arbitrary SurrealQL against the scheduler’s
replica. That port is meant to be reachable only from inside your deployment’s
private network.
The dashboard is the first surface intended for a browser, so it gets a listener
of its own. Publish 9668; keep 9667 private.
docker run -p 9668:9668 mono424/spooky-scheduler   # dashboard reachable
# 9667 stays on the internal network
Signing in
Two ways in.
Admin accounts (the normal path)
Any account on the _00_admin roster can sign in with its ordinary application
credentials. Grant access with the CLI:
spky admin add alice
spky admin list
spky admin remove alice
The scheduler signs in to your database through your app’s own record-access
method, then checks the resulting user against _00_admin. Nothing extra to
configure, and no second password to manage.
The access method is discovered from INFO FOR DB. If your schema defines
several record accesses and you want to pin one, set SPKY_ADMIN_ACCESS. Both
$username and $email are tried as the identifier parameter, so either
spelling of a SIGNIN clause works.
Break-glass password
Set SPKY_ADMIN_PASSWORD to enable a password-only login that needs no
database:
SPKY_ADMIN_PASSWORD='…'This exists because the roster path needs a working database, and a database that is down is exactly when you most want the dashboard. A session established this way is flagged with a persistent banner in the UI.
Leave the variable unset to disable this path entirely; there is no default password.
Session behaviour
How long a session lives depends on whether the scheduler has a cluster secret:
- With
SPKY_AUTH_SECRETset (always the case on Sp00ky Cloud), tokens are self-describing and HMAC-signed with a key derived from that secret. They verify without any server-side state, so they survive a scheduler restart, including one you trigger from the dashboard. Signing out adds the token to an in-memory revocation set; a restart forgets that set, so a revoked token comes back for the remainder of its own expiry. That trade is deliberate and is the whole cost of not logging you out when you press Restart. - Without a secret there is nothing to sign with that outlives the process, so sessions are random tokens held in memory and a restart means signing in again.
GET /admin/api/config reports which mode is active as sessions_persistent.
GET /admin/api/me reports the session’s mode (roster, breakglass, or
mcp for a token minted on the Access page) and its scope.
Failed logins are rate limited to 10 attempts per address per 5 minutes, and every failure returns the same response regardless of cause, so the endpoint cannot be used to discover which usernames exist.
Standalone use
The same bundle runs outside a scheduler. Opened from anywhere else, the sign-in form grows an endpoint field; point it at a scheduler’s admin port and it behaves identically.
pnpm --filter @spooky-sync/dashboard dev
# then enter http://your-scheduler:9668 in the endpoint field
The dashboard authenticates with a bearer token in localStorage, keyed per
endpoint, rather than a cookie — a cross-origin cookie would need
SameSite=None; Secure, which browsers refuse over plain HTTP, and plain HTTP
at an IP address is exactly how a scheduler is usually reached.
What it shows
Overview — a grid of tiles, one per question: the end-to-end sync latency
with a 30-minute chart as the large tile, then SSPs ready, backends healthy,
ingest lag and the scheduler’s own details beside it. The page paints from the
last state it saw the moment it opens (marked refreshing) and swaps in the
live poll a moment later, so a reload never shows an empty frame. A tile whose subject is
degraded is tinted, so the problem is the first thing on the page. The
latency is the scheduler’s own heartbeat probe: it writes _00_heartbeat:probe
upstream and times the full round trip through /ingest, the WAL, the
broadcast and every SSP’s circuit. It measures the real sync path, not a
synthetic ping.
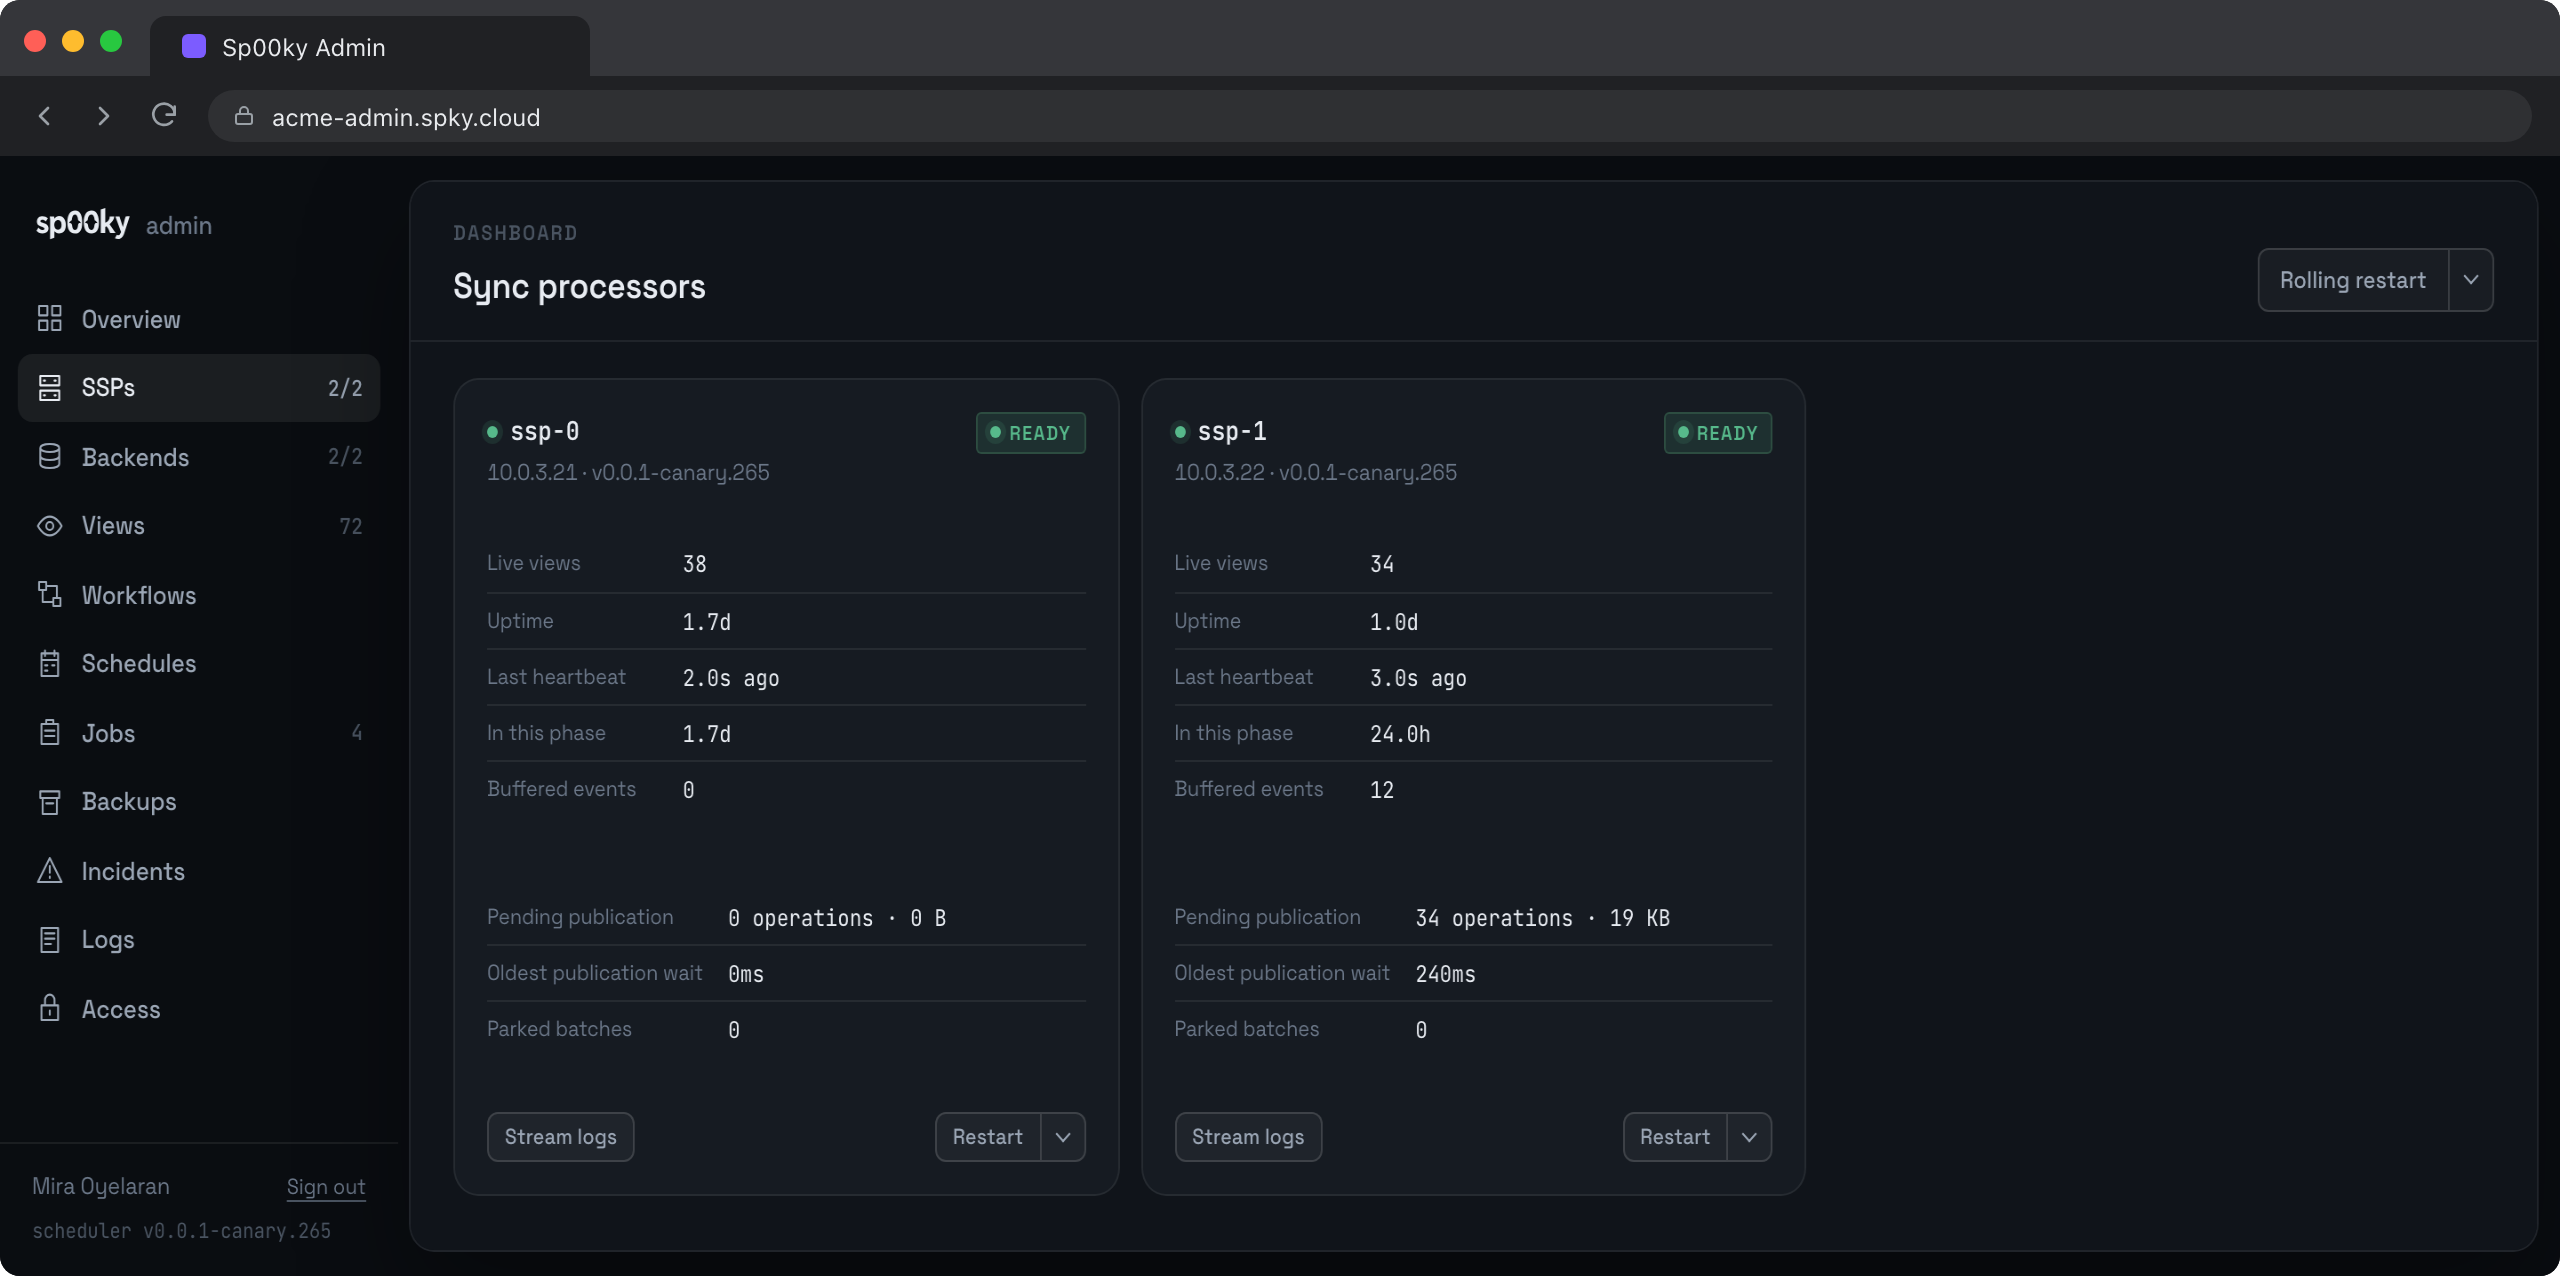
SSPs — per-processor status, live view count, uptime and environment. An SSP that is bootstrapping or replaying shows a progress bar: tables loaded and rows read when the SSP reports it, and otherwise the phase with its elapsed time against the scheduler’s bootstrap budget.
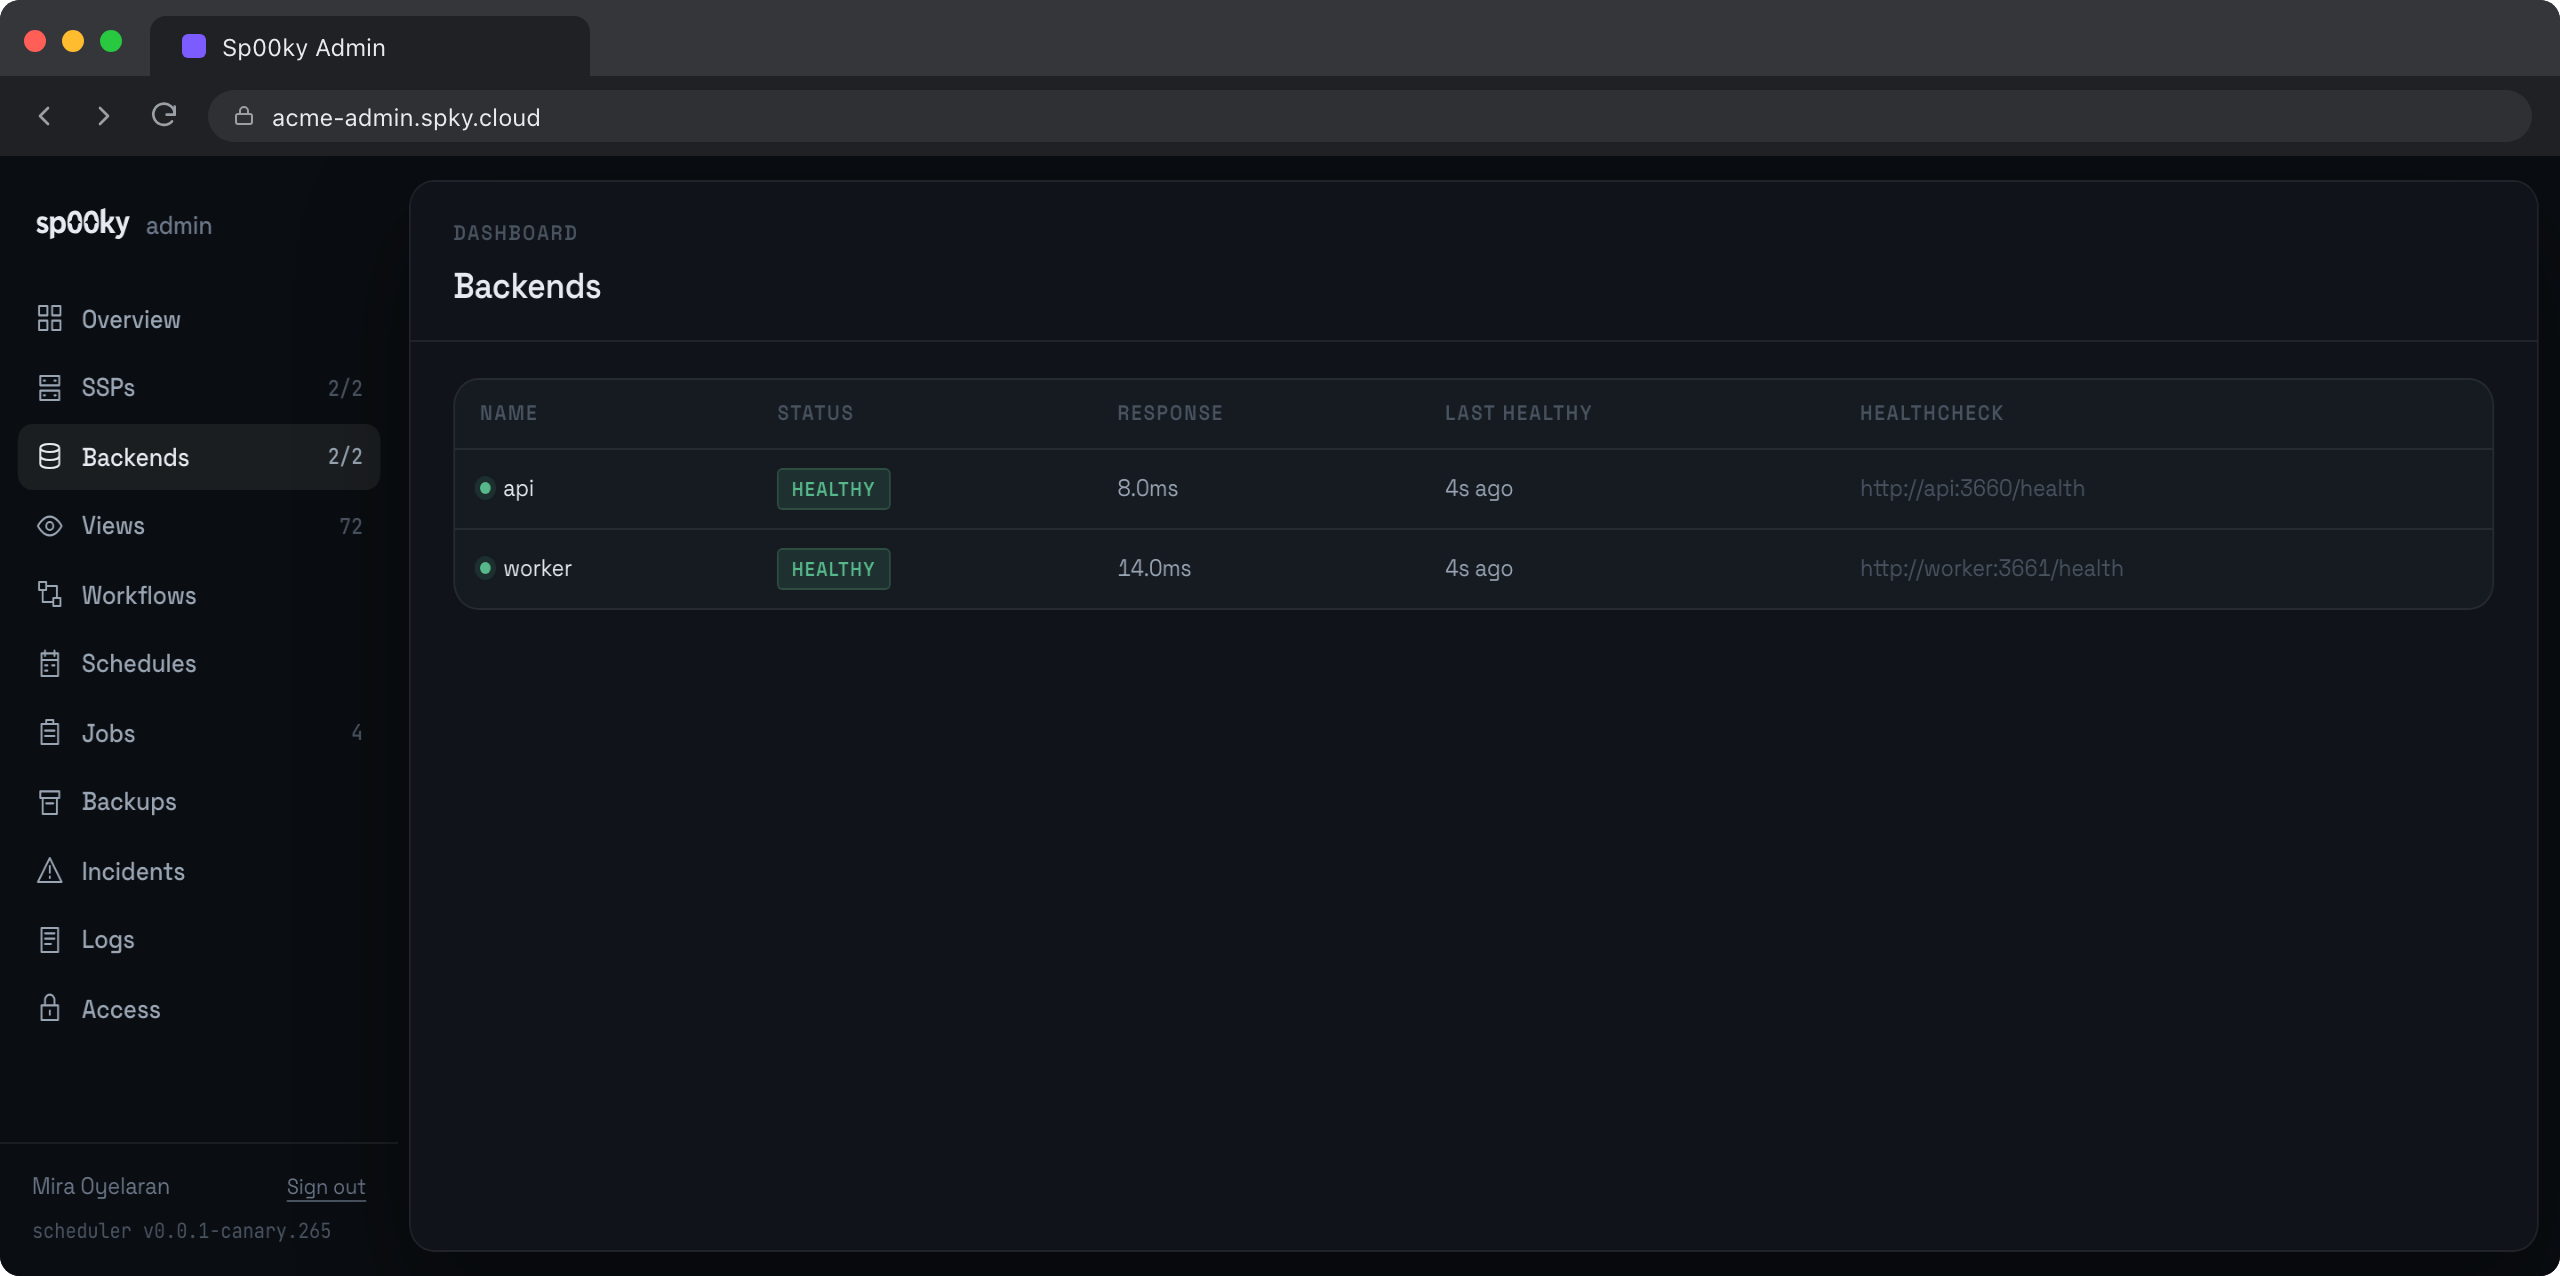
Backends — status and response time for everything in SPKY_BACKENDS, with
a detail page carrying a ~30-minute response-time history and the resolved
healthcheck URL. Environment values are masked by the scheduler before they
leave it. On Sp00ky Cloud each deploy pushes the list; the scheduler stores the
last pushed list (env values masked) in _00_scheduler_state and reads it back
when it starts, so a restart or reclone between deploys keeps its backends. A
list in SPKY_BACKENDS always takes precedence. A backend that runs on a machine pool (run_on: { pool: ... }) is
not probed: between jobs there may be no machine to answer, and that is not an
outage. Its status is what the pool sweep last saw: idle at zero machines with
nothing queued, starting while a machine boots or a job waits for one,
healthy with a ready machine, unhealthy only when the pool’s boot-failure
breaker is open or its last pass failed. No backend_down incident is ever
opened for it; the pool’s own pool_breaker_open incident carries the reason
when it cannot get a machine.
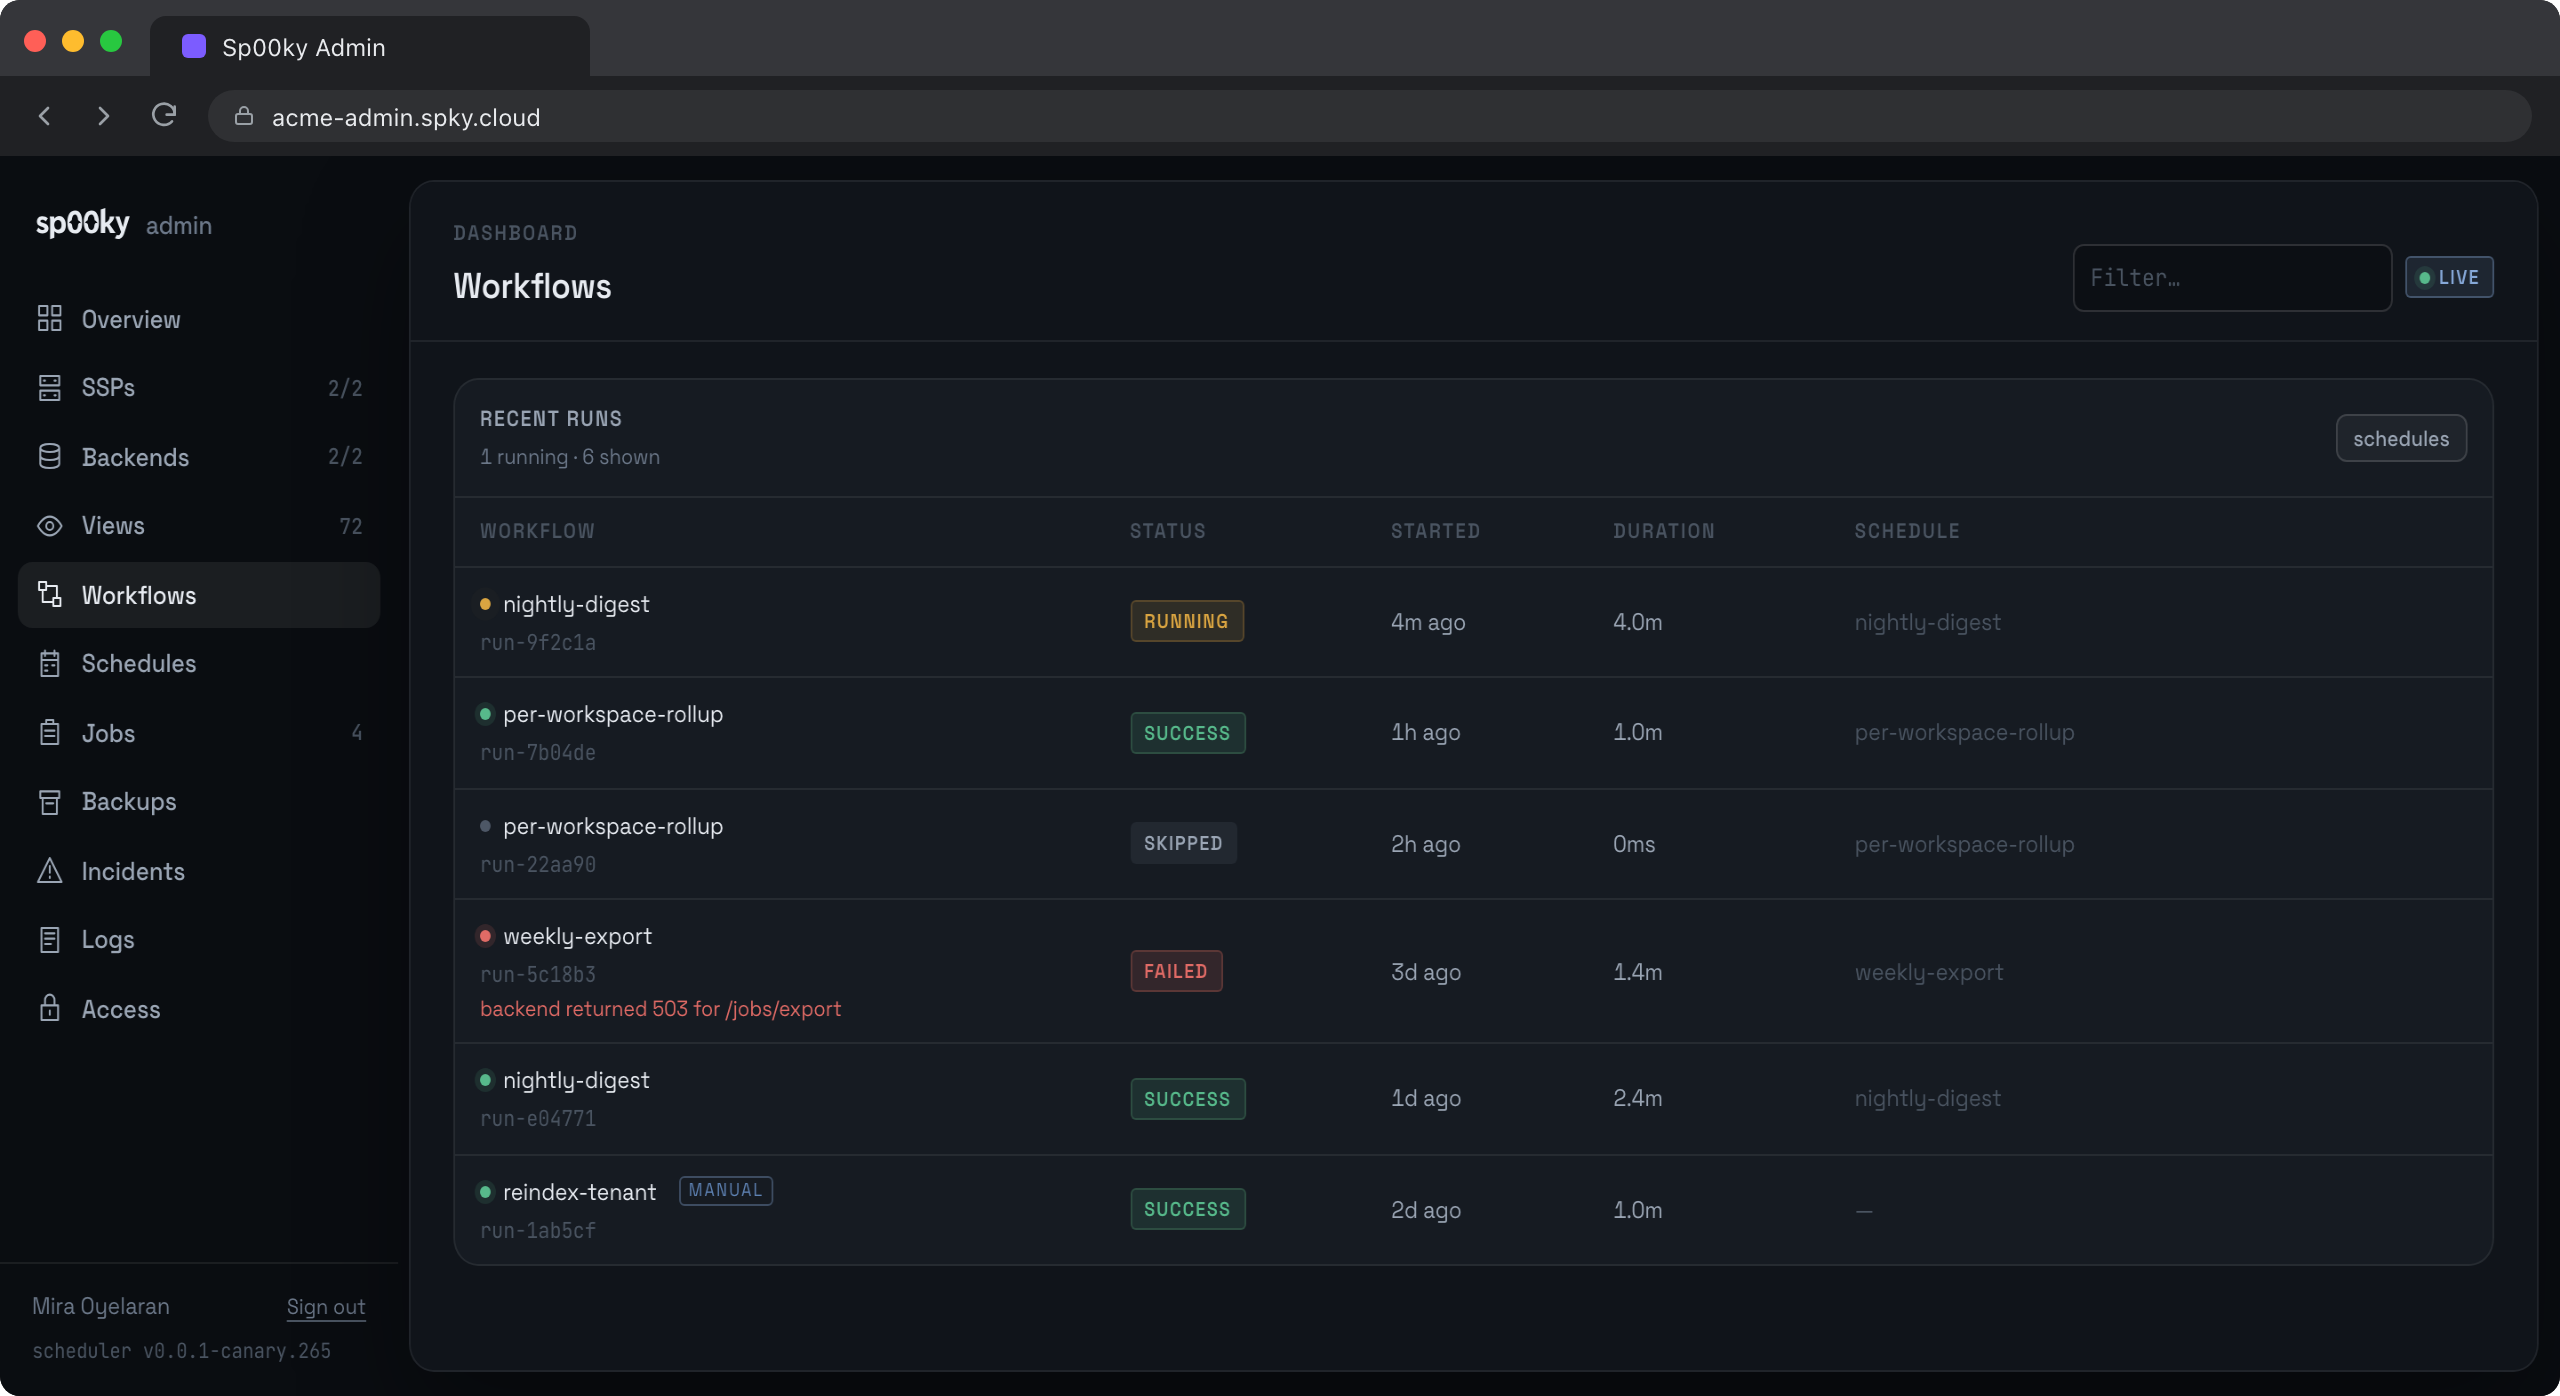
Workflows — runs updating in real time, and a run page built around a
timeline: every step plotted on one shared axis, so where the time went is
visible at a glance rather than reconstructed from timestamps. Each row in the
list carries the run’s own failure reason, so four failed runs do not cost
four clicks to tell one problem from four. Click a step to expand its job,
output and error inline. A step still waiting on its dependencies is drawn
hatched at the origin rather than as a bar, because it has not run. The
scheduler runs a single shared poller behind the live list, so ten open
dashboards cost your database exactly what one does, and a closed one costs
nothing.
An expanded step also loads its job, which is where a failure says what
actually happened: the step row keeps only the attempt that ended the job, while
the job’s errors array keeps every attempt. A step that failed after two
timeouts and a 502 is a different problem from one that 502’d immediately, and
only the job can tell them apart. The job is fetched per opened step rather than
with the run, so a fan-out run with hundreds of steps costs nothing extra.
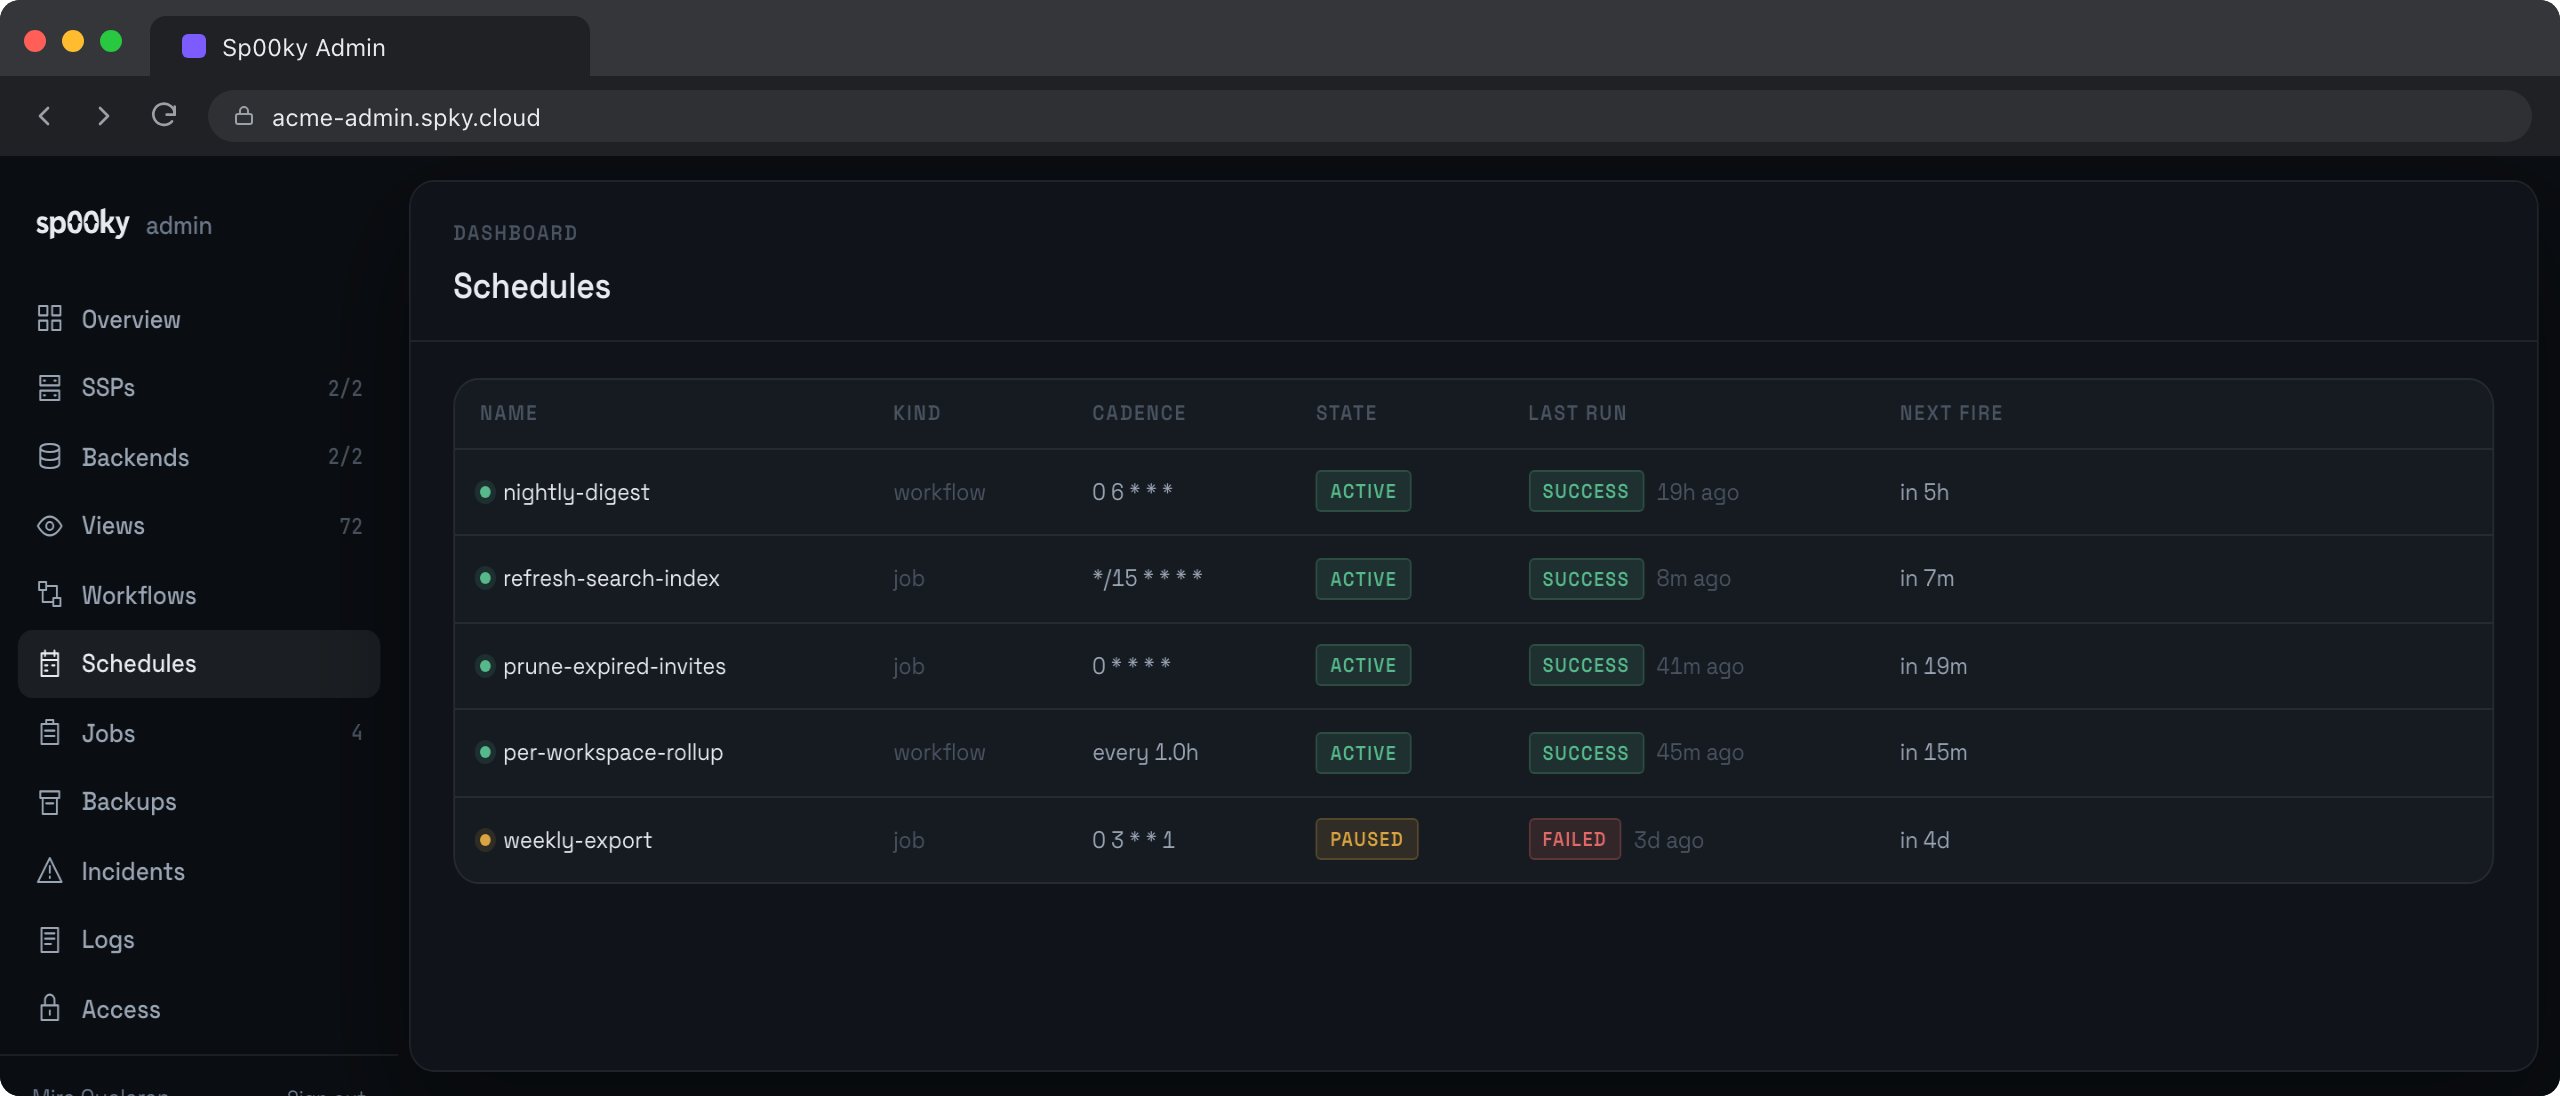
Schedules — the definition, the next fire, recent fires, and a
success/failure tally. The tally comes from _00_run_rollup rather than
counting run rows, so it stays accurate after retention has pruned them. Each
fire shows why it ended as it did, and a schedule whose fires are being
suppressed says so at the top of the page, naming the run that is holding the
key — a wall of skipped rows looks like “nothing to do” and means “something
is still running”.
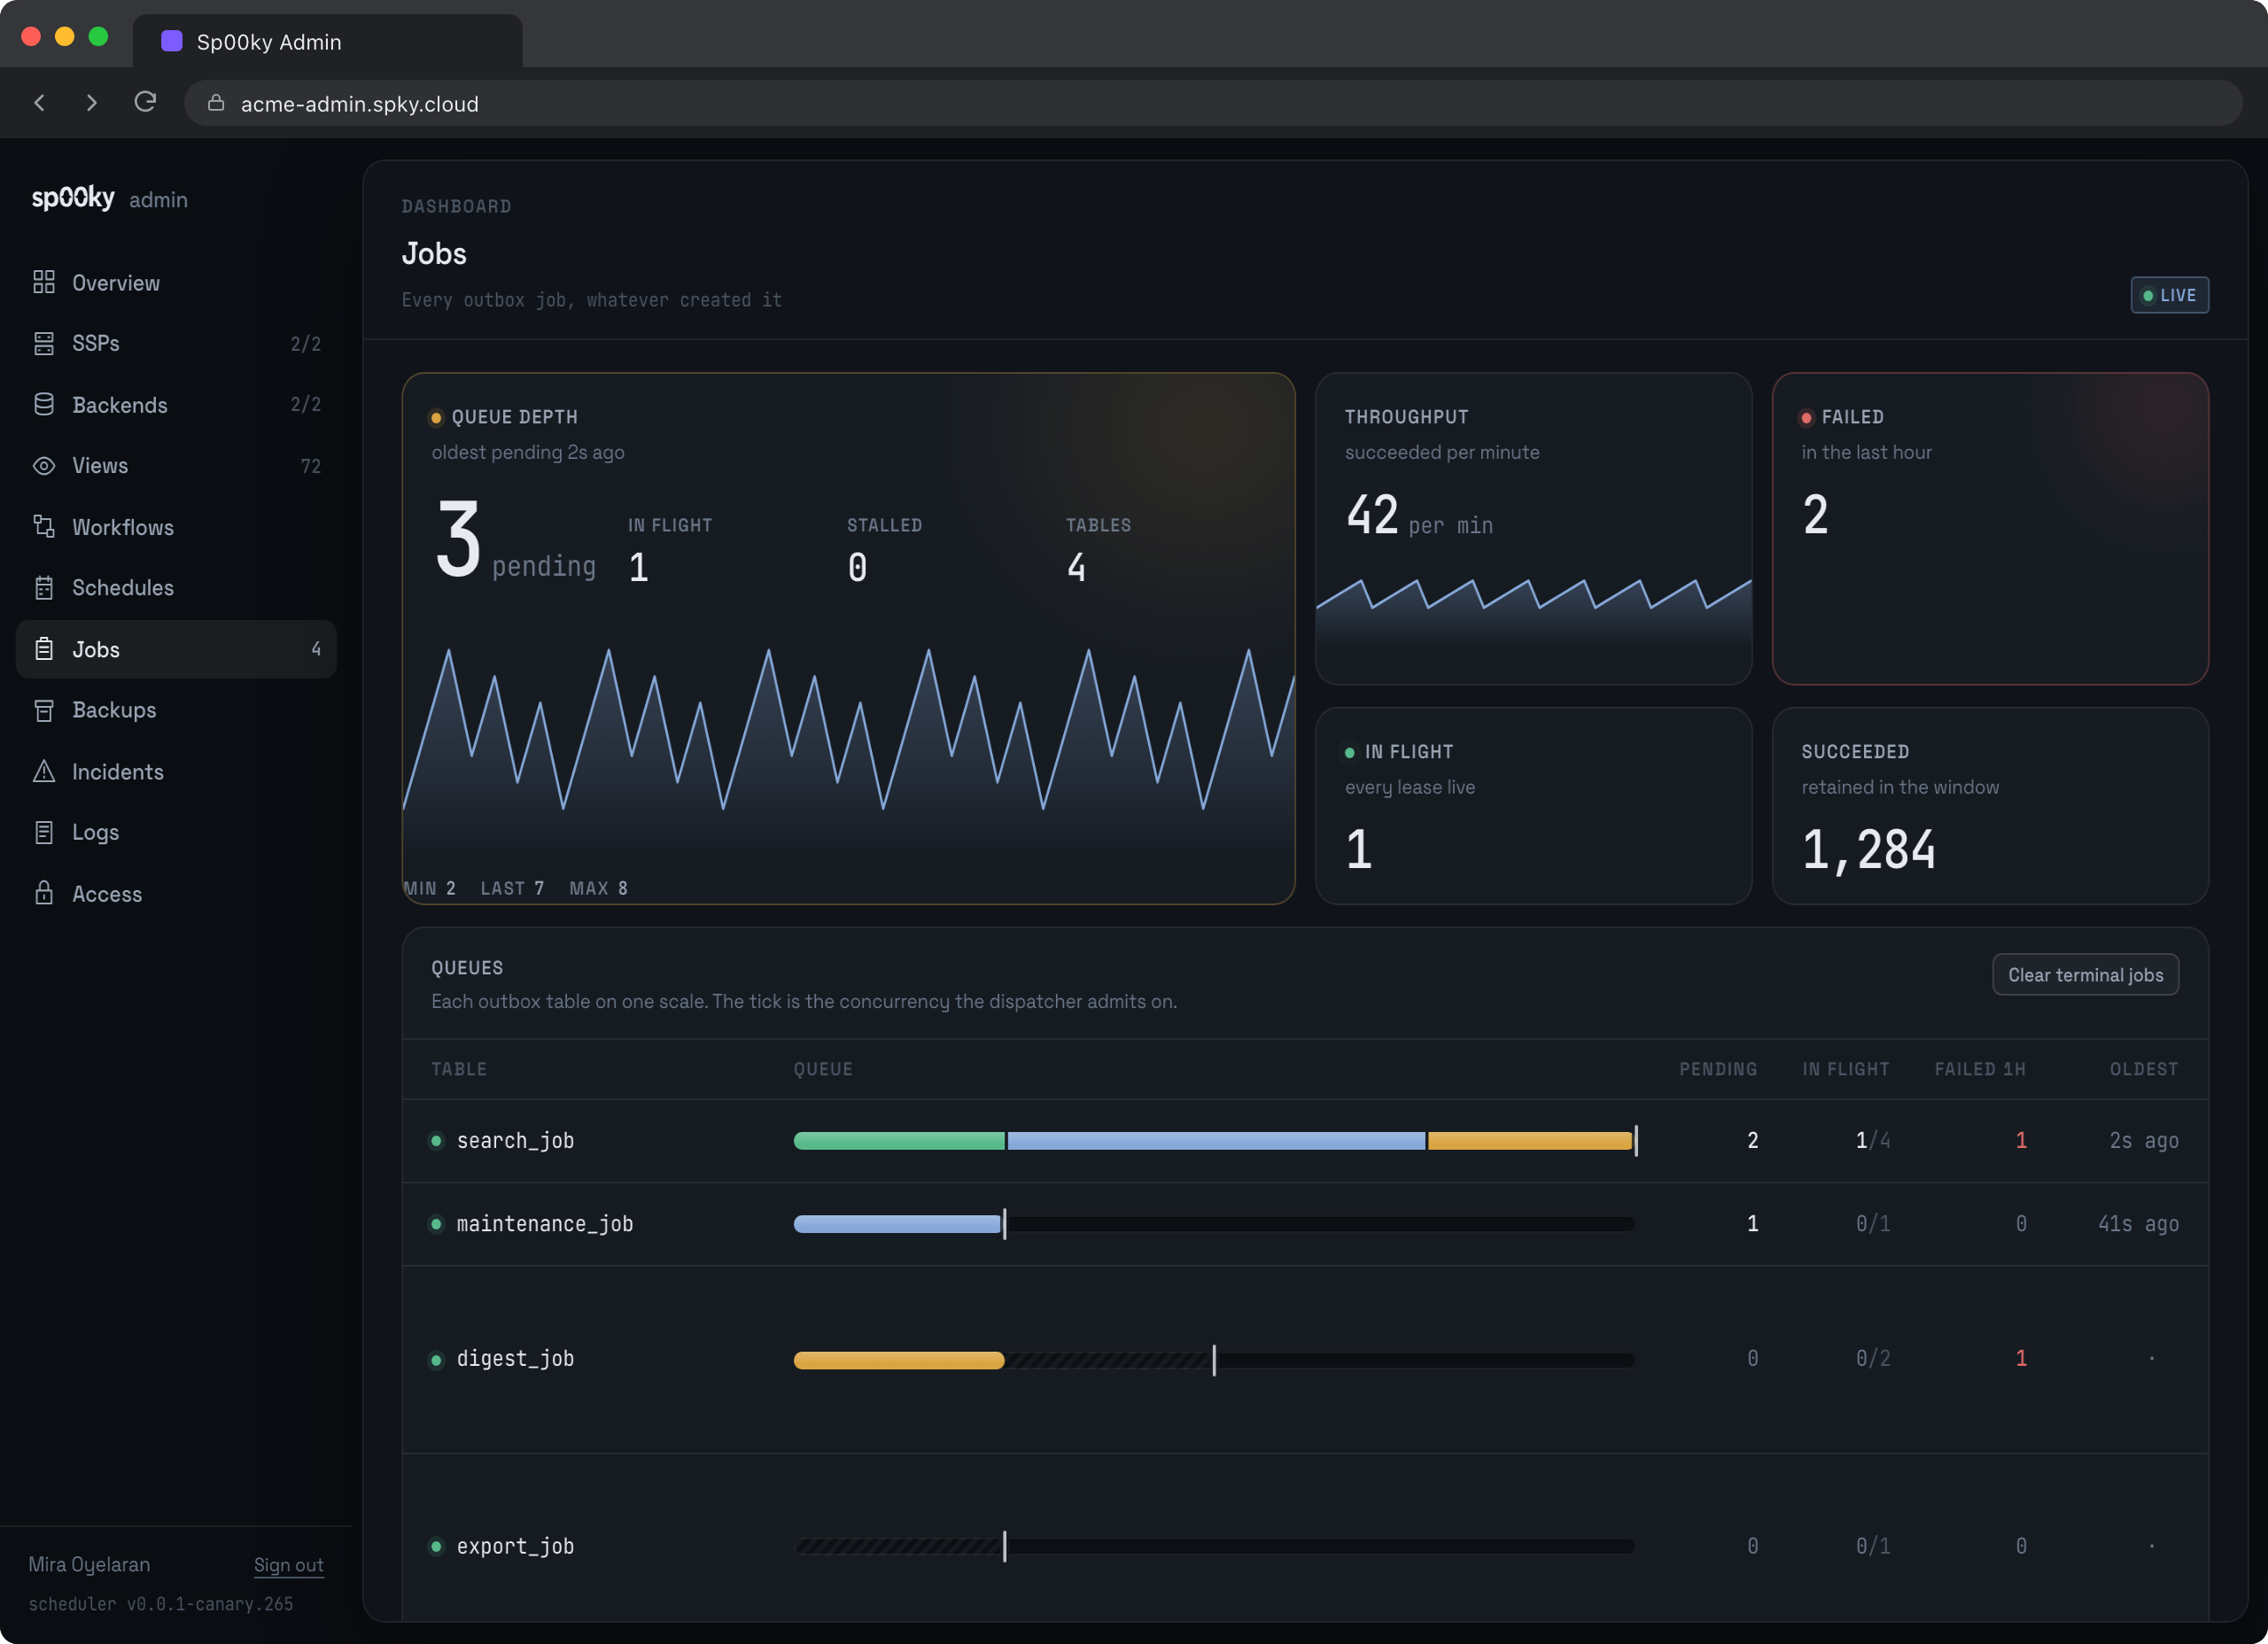
Jobs — every outbox job in one list, whatever created it. This is the only
place two whole classes of work are visible at all: a kind: job schedule’s
fires, and jobs your own code created, which belong to no schedule and no
workflow. Each row says where it came from, and links back to the schedule or
the workflow step when the owning run still exists — a terminal run is pruned on
its own retention window well before the jobs that outlived it, so “scheduled
work whose fire has aged out” and “a job nobody can account for” are deliberately
not drawn the same.
The top of the page is the queue itself: a Queue depth tile with the pending count and its history from the sampler, throughput, failures in the last hour, in-flight and succeeded beside it, then Queues, one lane per outbox table drawn on a shared scale (in flight, stalled, pending and failed as segments, a tick where the table’s concurrency sits). Clicking a lane’s name filters the list below to that table.
Filter with the chips by origin (schedule, workflow, app), by status, by
table, or by a substring of the path. The filter is pushed into SurrealQL rather than applied to
the page that was already fetched, so asking for application jobs on a busy table
returns them instead of reporting none.
The tiles above the list are the queue itself: pending depth with the age of the
oldest one, in-flight against each table’s _00_job_policy concurrency ceiling,
failures over the last hour, and jobs succeeded per minute. Stalled is called
out separately from in-flight and is worth knowing: it is a processing row
whose lease has expired, meaning nobody is working on it and a recovery sweep
will reclaim it on its own clock. The schema has no status for that state, which
is exactly why it earns a name here.
Counts cover work in flight plus the last hour of terminal work, never all of
history. Once retention keeps failures longer than successes, an all-time ratio
reports a failure rate that climbs as successes age out; a bounded window is the
only honest denominator, and it is the one spky jobs uses too.
Every job aggregate is a scan of one of your own tables, so the scheduler takes them once
, in a single sampler that every reader serves from — the same bargain the presence sampler
strikes. It reads every 15 seconds while nobody has the page open and every 2 seconds while
someone does, so ten open dashboards cost what one does and an idle cluster costs almost nothing.
Tune both with SPKY_ADMIN_JOB_INTERVAL_SECS and
SPKY_ADMIN_JOB_LIVE_INTERVAL_SECS, or set the first to 0
to switch the sampler off entirely: the list and its filters still work, the totals and the
Overview tile then say they are not being measured rather than showing zeros.
Logs — a live tail of the scheduler’s or any SSP’s log output, with level and text filters. If a viewer falls behind, the gap is shown explicitly rather than hidden.
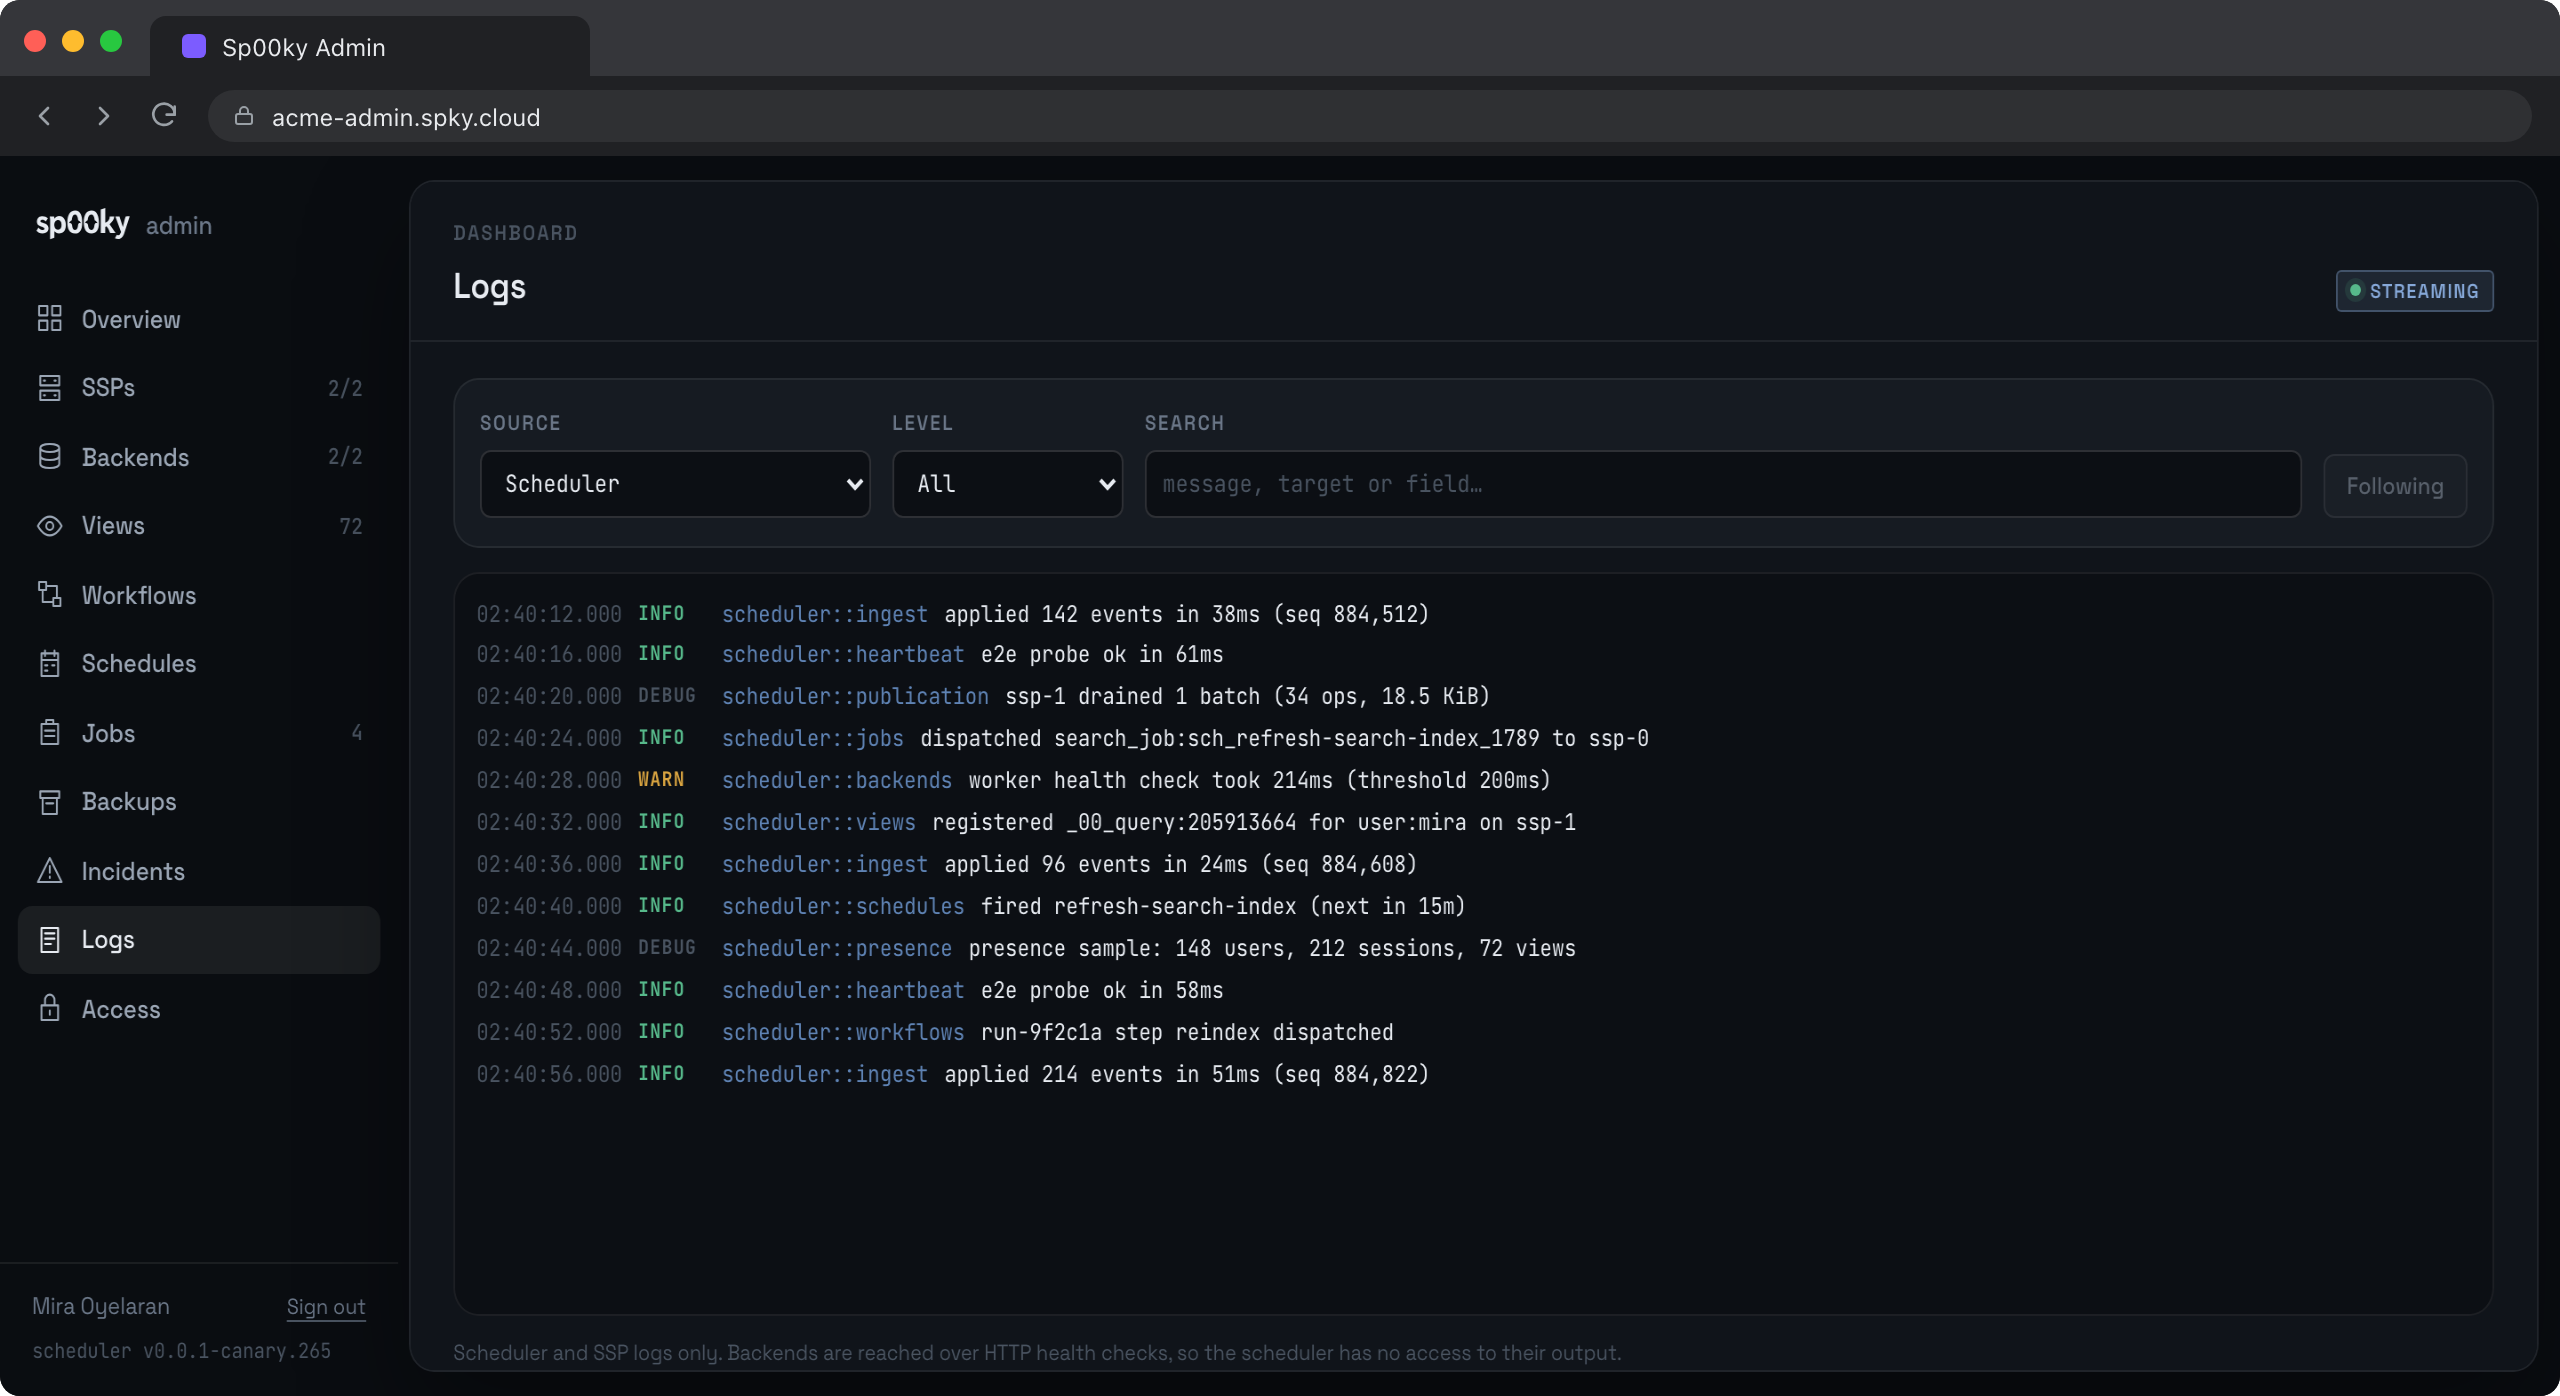
Backends have no log stream: the scheduler reaches them with HTTP health checks and has no access to their output.
Actions
Everything the dashboard can do, as opposed to show, goes through the
scheduler. Every action logs the signed-in subject, and the long-running ones
answer 202 with an operation the dashboard watches (see below).
Restarting an SSP
The scheduler never touches a container. Restarting an SSP means flagging it
in the pool; the SSP’s next heartbeat is answered with 409 and a JSON
ResyncDirective, the SSP exits, and its supervisor relaunches it through the
same register, bootstrap and verify path every SSP takes on boot. A restart
from the dashboard is indistinguishable from one by Docker.
| Mode | What happens |
|---|---|
restart | Flag, 409, exit, relaunch. The SSP restores its circuit snapshot and catches up the delta. |
clean | The directive carries clean: true, so before exiting the SSP deletes its snapshot.json and its arena directory. The relaunch is a cold rebuild from the database. Use it when the snapshot itself is suspect. |
reload | No exit. The scheduler calls the SSP’s POST /admin/reload, which rebuilds the circuit in-process from the database. Schema changes do not need it (they are applied live), but it is there for a suspect circuit. |
Nothing happens until the next heartbeat (5 s by default). An operation is
marked done when the SSP has re-registered and reached ready, and
failed if that has not happened within one heartbeat interval plus the
scheduler’s bootstrap timeout plus 30 s. An SSP older than this release reads
the directive as free text and restarts anyway, so a clean on it degrades to
a plain restart; the operation records the SSP’s version so you can tell.
Restart all defaults to rolling: one SSP is flagged, the scheduler waits for it to come back ready, then flags the next, in id order. Queries are pinned to an SSP, so taking one down is already an outage for its clients; taking all of them down at once is an outage for everyone. All-at-once is still offered for the case where you want exactly that. A roll stops at the first SSP that does not come back, because continuing would take down the next one while this one is still missing. Only one roll runs at a time.
Restarting the scheduler
| Mode | What happens |
|---|---|
restart | The scheduler answers 202, waits for the response to flush, and calls exit(0). Sp00ky Cloud runs it under Docker’s unless-stopped, which relaunches on any exit code, and the startup integrity check runs again on boot. |
reclone | Resets the local replica and re-fetches everything from upstream SurrealDB, then flags every SSP to re-verify. The same thing POST /admin/resync on the ingest port does. Runs as an operation, because it can take minutes. |
rehash | Keeps the replica’s rows and recomputes the persisted snapshot hashes from them, then flags every SSP. Repairs hash-metadata drift without a refetch. |
A scheduler run from a checkout has no supervisor and simply stops.
GET /admin/api/config reports supervised (true when SPKY_ENV=cloud) so
the dashboard can say so before you press the button rather than after.
Reclone and rehash are refused with 503 while the scheduler is cloning or
restoring, and with 409 while another reclone is running.
Cloud-only actions
Some things are not the scheduler’s to do: pulling a newer image, wiping its
own volume (RocksDB holds the files open), bouncing SurrealDB, and the backup
catalog with its schedule and retention. Those belong to Sp00ky Cloud, which
owns the containers and the backup rows. When the scheduler is linked (see
Configuration) the dashboard offers them and the scheduler
forwards the request; when it is not, every such action answers 409 with
Not linked to Sp00ky Cloud, and the dashboard shows the option disabled with
that sentence beside it.
If Sp00ky Cloud refuses the scheduler’s credentials, the dashboard shows a
502 with code: cloud_auth and the sentence from the control plane. It is
never relayed as a 401: that status means “not signed in” to the dashboard,
and a cloud refusal has nothing to do with your session.
POST /admin/api/cloud/restart takes {roles, upgrade, clean, surreal} with
exactly the meaning of spky restart: upgrade force-pulls the latest
scheduler and SSP images, clean wipes the scheduler’s volume (and always
includes the scheduler in the role set), surreal also bounces SurrealDB.
Empty roles means scheduler plus SSPs. A request that recreates this
scheduler will, by definition, not be reported done by it; the dashboard’s
reconnect loop observes the outcome instead.
Operations
Every asynchronous action records an operation: kind, target, who asked,
start and finish times, status (running, done, failed), the server’s
own closing message, and free-form progress ({done, total, current} for a
rolling restart, the registry state for a backup).
GET /admin/api/operationslists the most recent ones, newest first.GET /admin/api/operations/streamis an SSE stream (eventoperations) that sends the whole list on every change.GET /admin/api/overviewembeds the running ones, so the poll the dashboard already makes shows activity without a second request.
Operations live in memory, bounded at 50. Finished ones are evicted oldest first; a running one is never evicted, however old, because a stuck operation is exactly what you still need to see. They are a UI convenience, not an audit log: the audit trail is the scheduler’s own log output.
Workflows, schedules and jobs
| Action | What happens |
|---|---|
| Cancel a run | Sets kill_requested and runs the kill immediately: every dispatched step’s job gets /job/kill broadcast to the ready SSPs. Sub-second, with the flag as the durable fallback the next sweep would act on. 409 unless the run is running. |
| Rerun | A brand-new ad-hoc run with the same frozen DAG, input and target table, trigger: manual, and rerun_of pointing at the source. It has no owning schedule run, never counts towards concurrency: skip, and rolls up under (ad-hoc). Any source status is allowed. |
| Retry from failed | Only for a failed or killed run. Resets failed and skipped steps to blocked, keeps successful steps and their outputs, reopens the run (and its owning schedule run, so the outcome is mirrored there) and dispatches the reset steps again under new job ids of the form <table>:wf_<run key>_<step>_r<n>. Old job rows are left as history; a job row is never deleted or re-created under the same id. Refused with 409 step <name>'s job is still processing; wait for the kill to settle while a killed step’s job has not gone terminal on its SSP, because resetting it before the kill lands would run the step twice. |
| Pause / resume a schedule | Writes paused on the _00_schedule row, the same field spky schedules pause writes. |
| Run a schedule now | Writes trigger_requested_at. 409 while the schedule is paused (pause wins over a queued trigger, so the fire would silently never happen) or disabled in its config. |
| Kill / retry a step’s job | The cluster /job/kill (broadcast to every ready SSP) and /job/retry (one SSP is picked). The SSP’s own verdict is relayed: a 409 for a job that is not terminal, a 404 for one it does not know. |
Retrying the latest fire of a schedule leaves _00_schedule.last_run_status at failed even when
the retry succeeds: the engine only lets a failure overwrite an equal last_run_at. The run and
schedule-run rows are correct; only that summary field lags.
A scheduler upgraded before spky deploy has migrated the schedule tables
answers 409 asking you to run it: rerun and retry write fields
(trigger, rerun_of, retry_count as option<int>, last_retry_at on _00_workflow_run)
that older schemas do not have.
Access
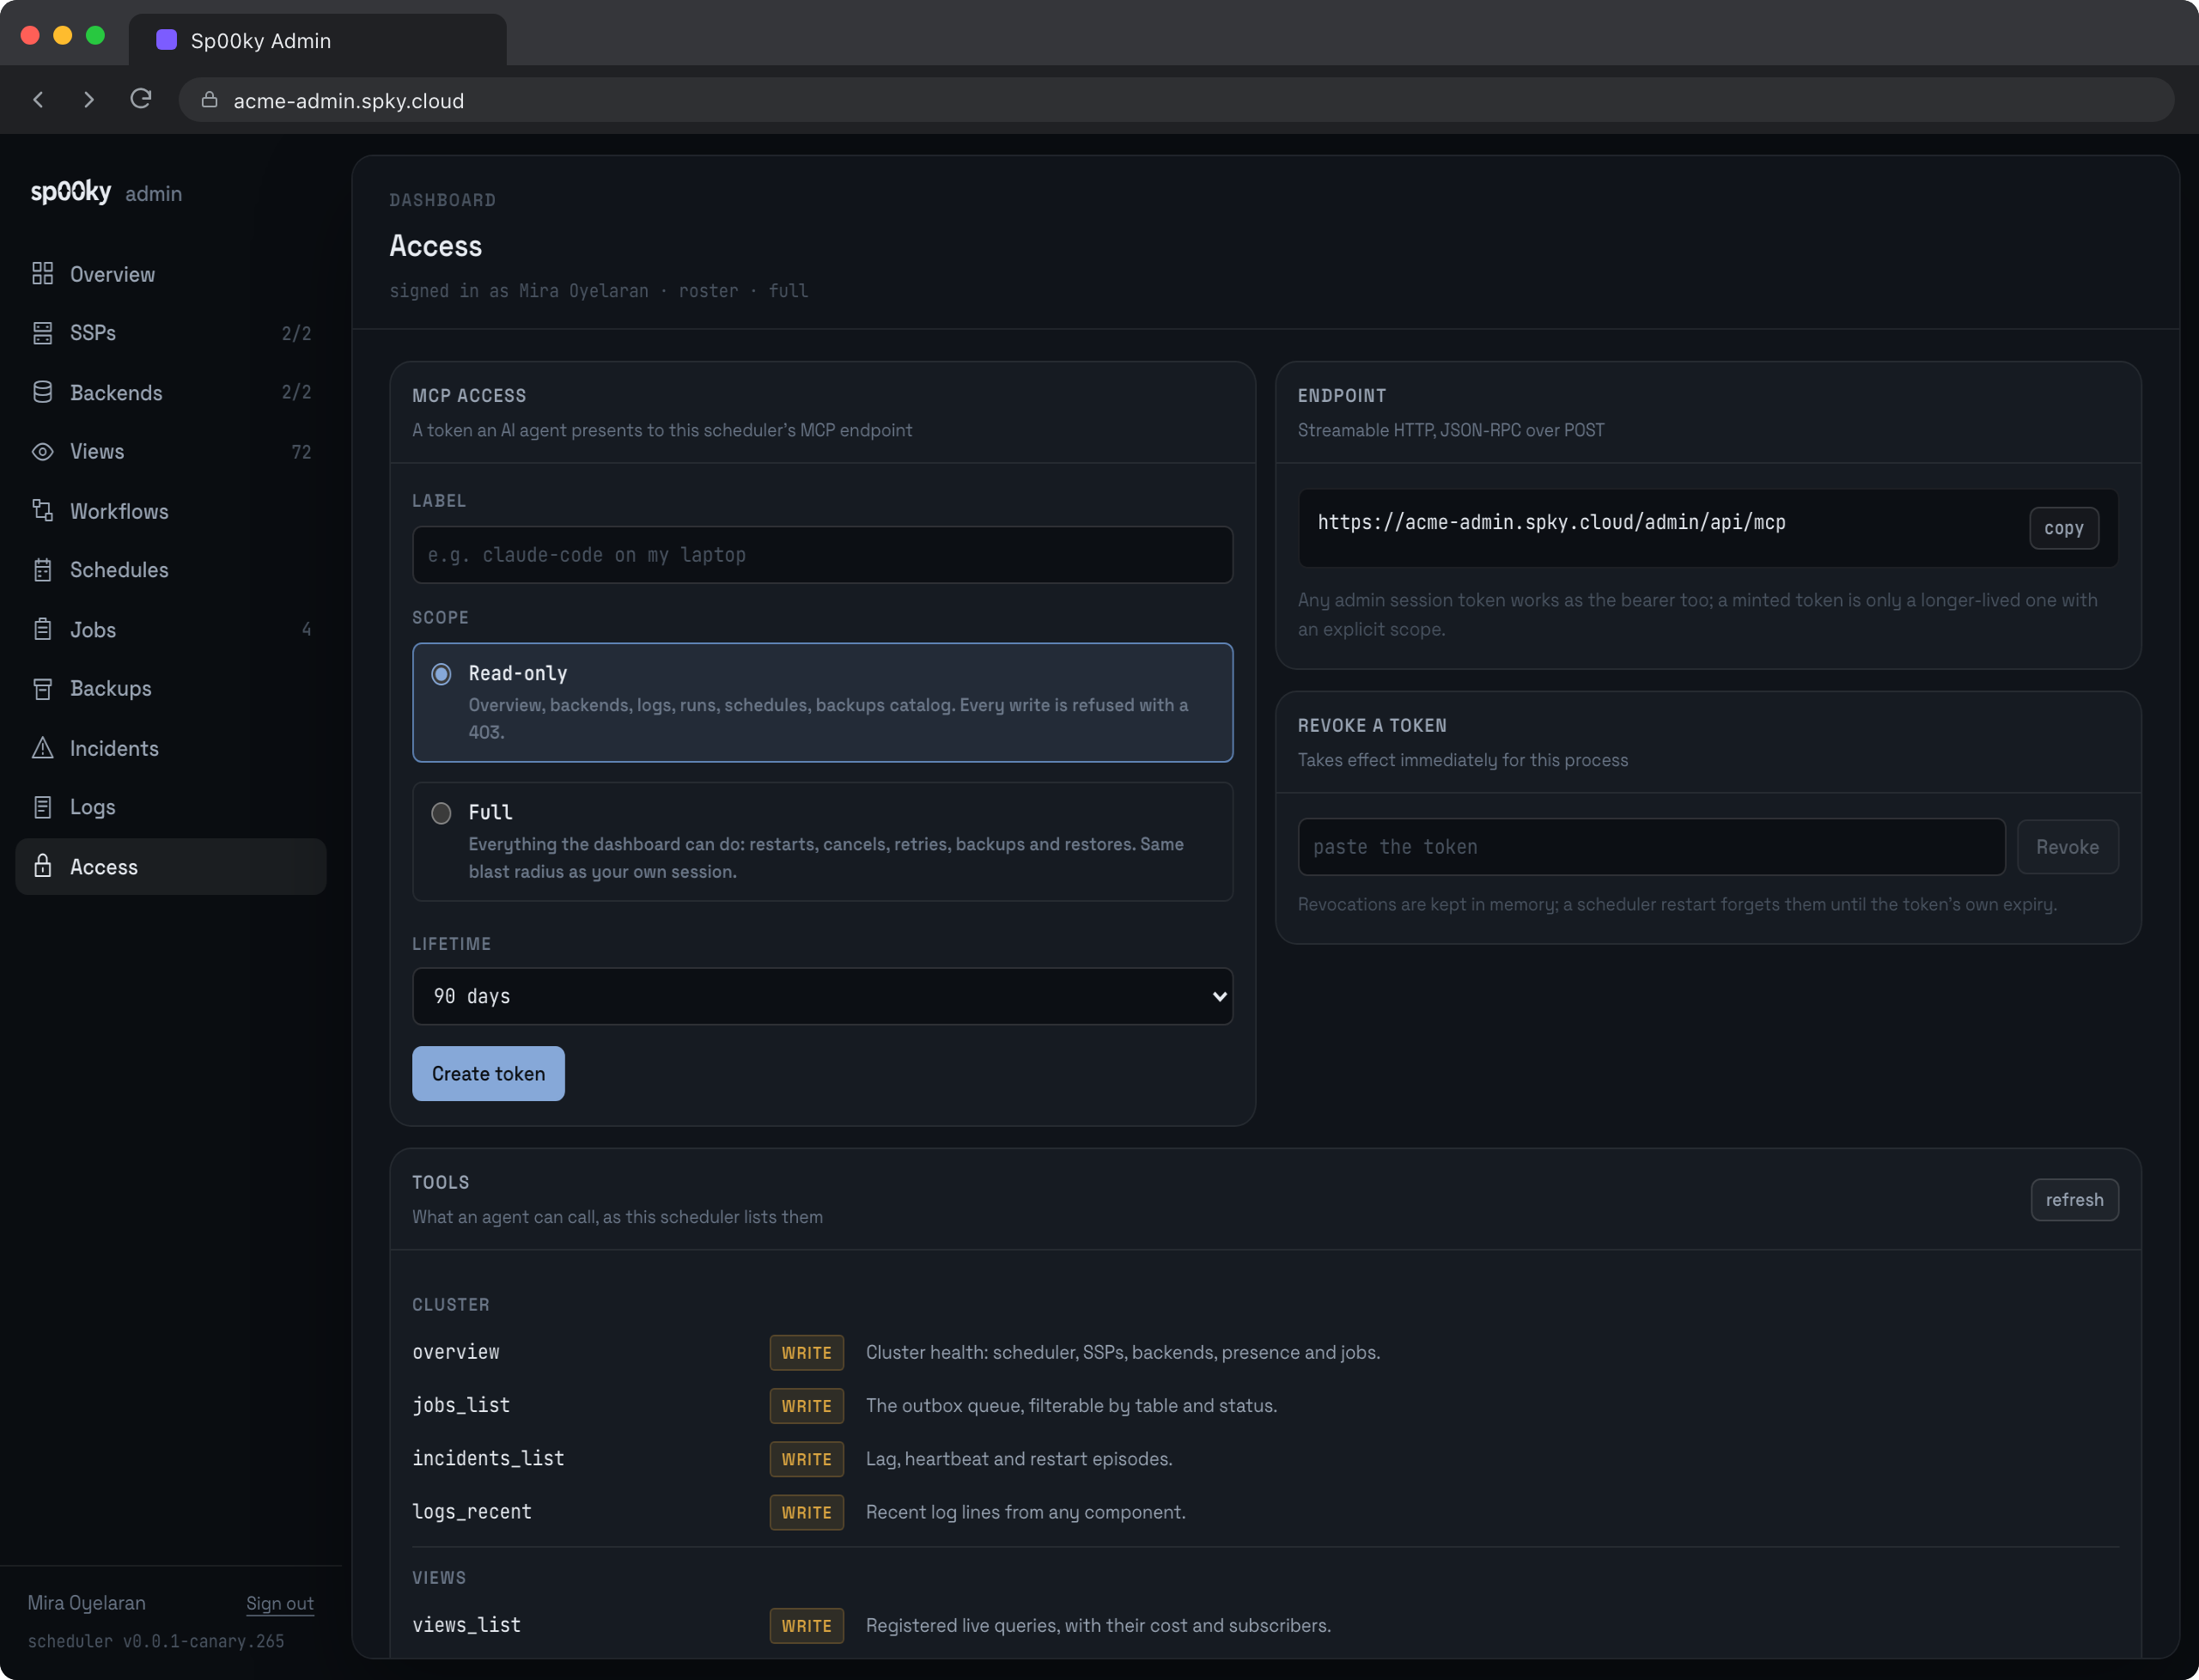
The Access page mints long-lived tokens for MCP clients, so an AI agent can
do everything this dashboard does through the
scheduler admin MCP at
/admin/api/mcp. A token has a label, a scope and a lifetime of up to 365
days, and is shown once; the page prints the claude mcp add command and the
Cursor and VS Code snippets with everything filled in. Paste a token back to
revoke it.
| Scope | Meaning |
|---|---|
read | May only make GET requests to the API. Any other method answers 403 This token is read-only |
full | Everything the signed-in operator can do |
The bearer middleware enforces that on every request, so a read token binds an
agent exactly as it binds a browser. POST /admin/api/mcp is the single
exception, and it has to be: MCP carries reads over POST as well, so the
endpoint is exempted from the method check and enforces scope per tool
instead. A read token’s tools/list lists only read tools, and calling a
write tool anyway comes back as a tool error rather than a result. The reach
is the same either way, only the place it is checked differs.
Roster and break-glass sessions are always full. An MCP token cannot mint
further tokens; only a person’s own session can. Tokens follow the
session rules: signed and restart-proof when
SPKY_AUTH_SECRET is set, in memory otherwise.
Backups
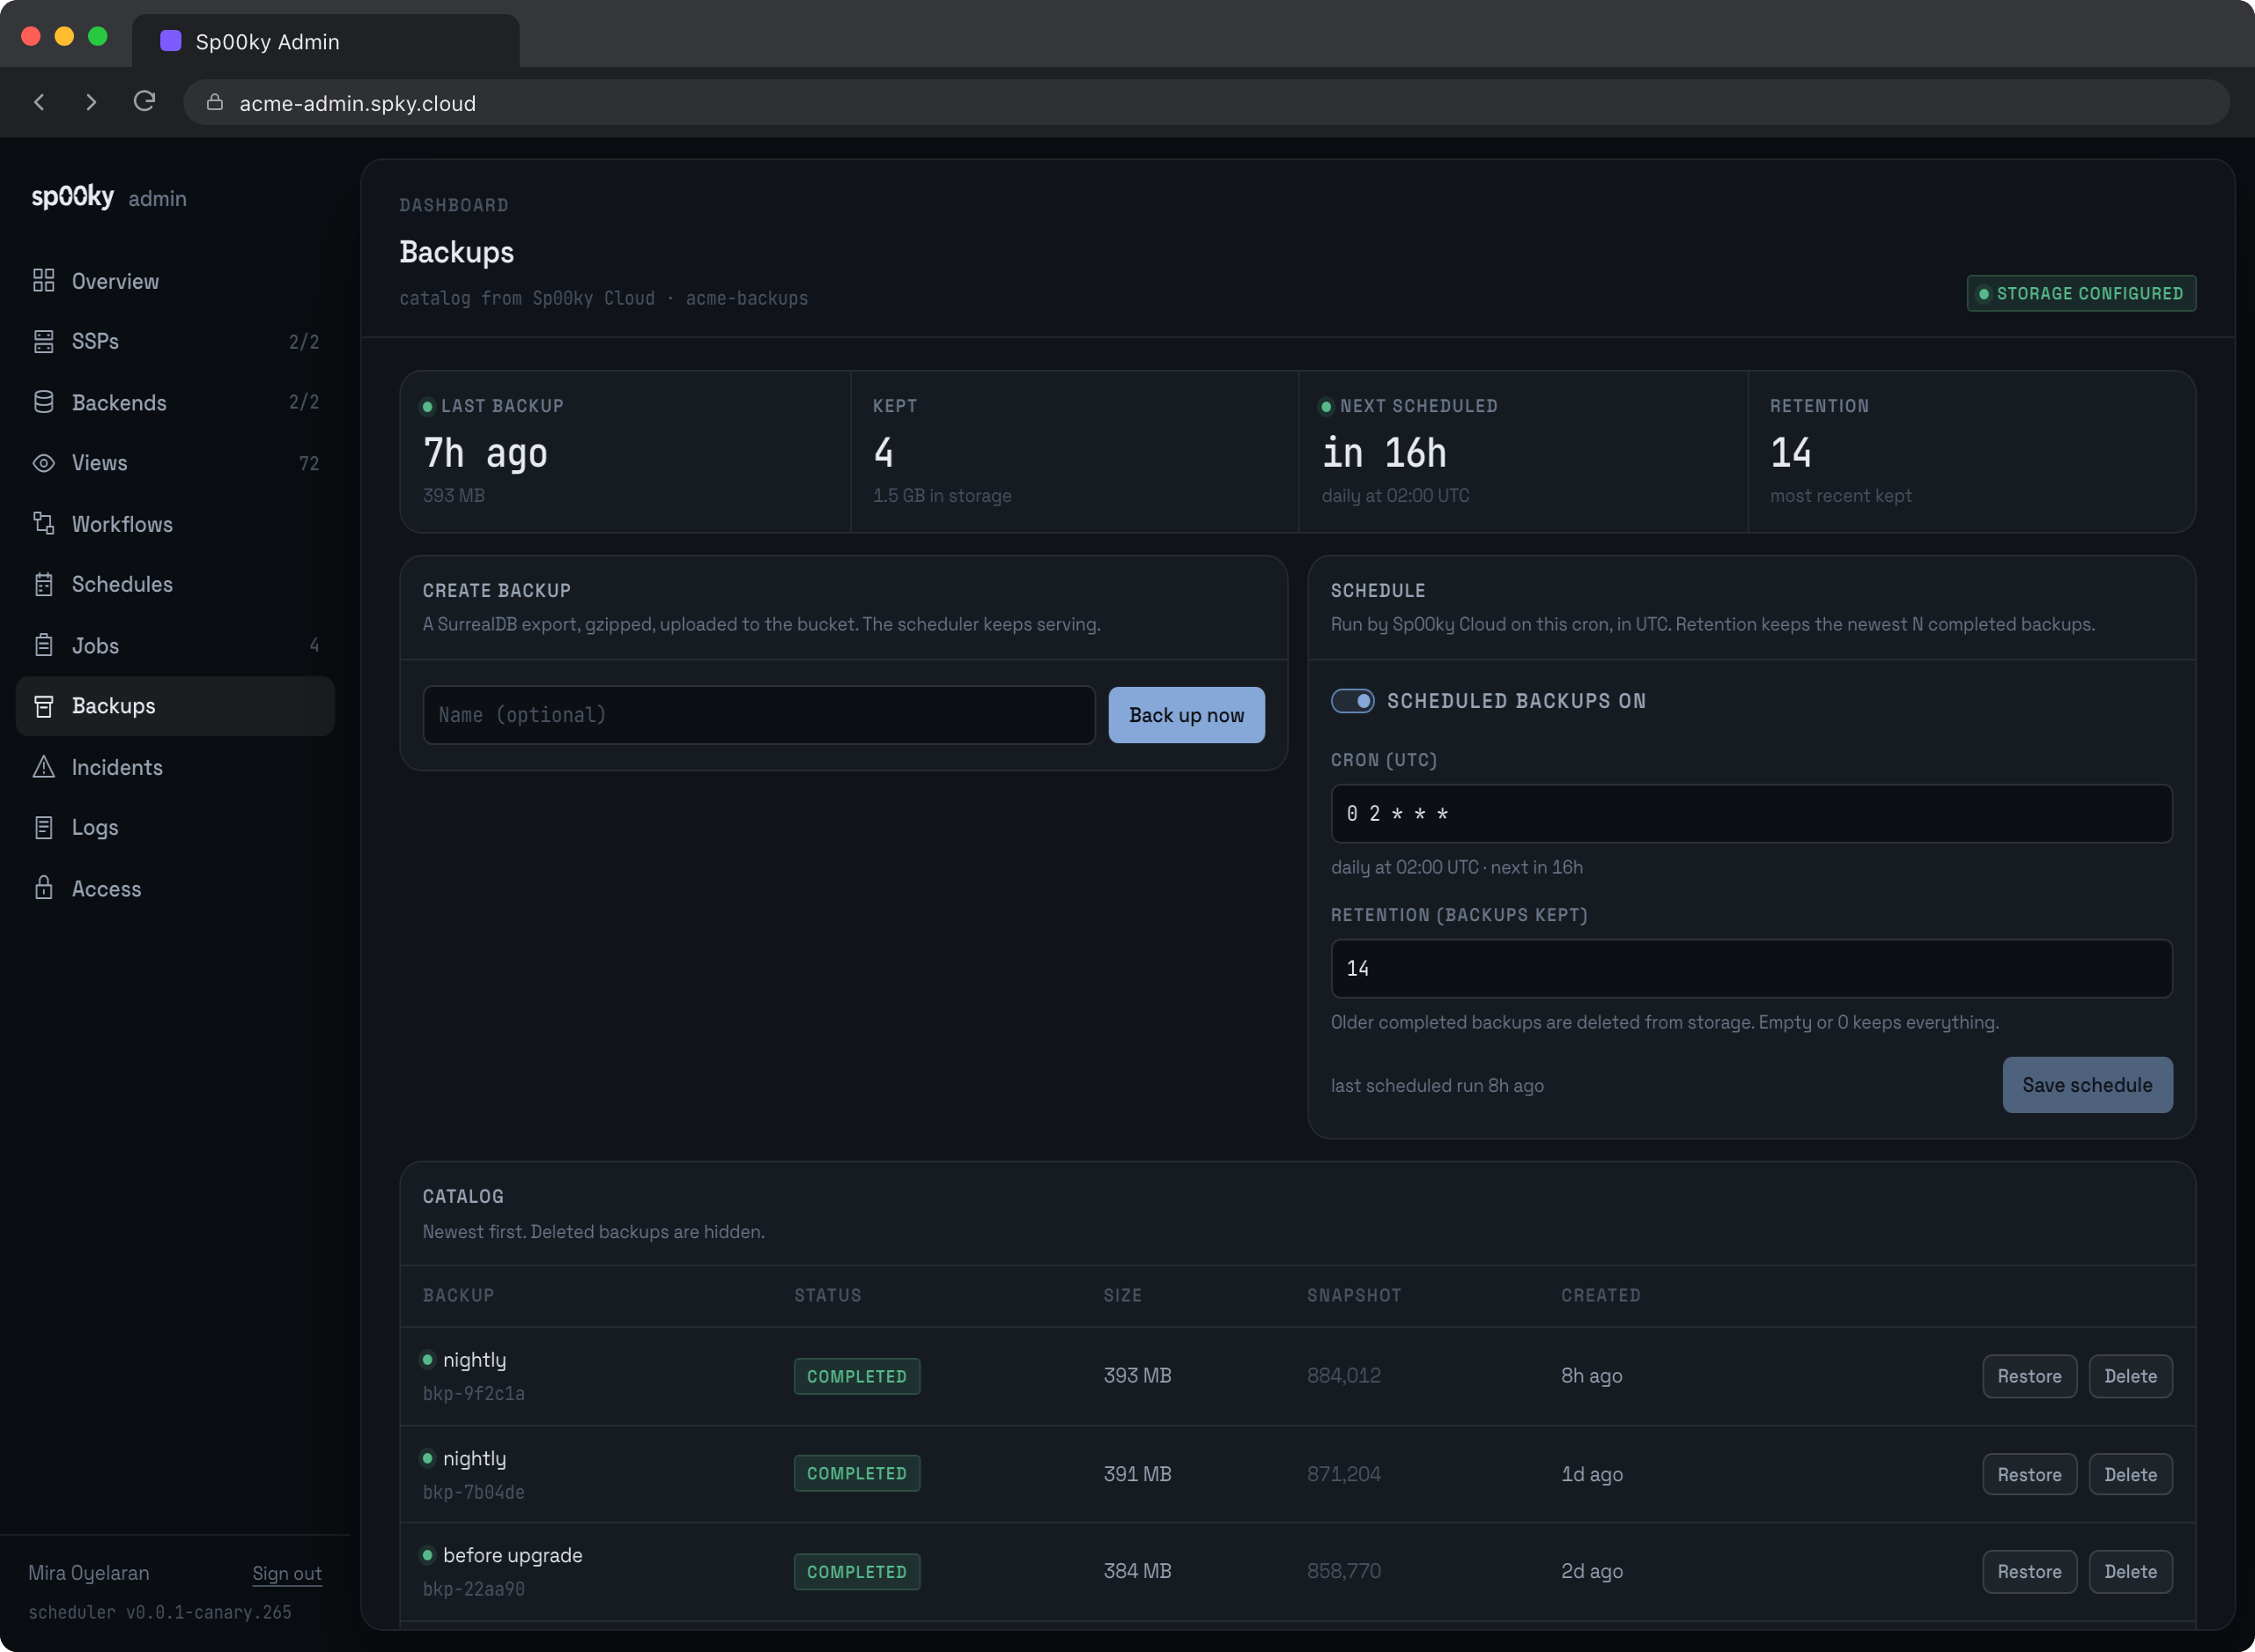
The Backups tab merges two sources rather than choosing between them:
- This scheduler executes backups and restores. Its registries know the live state of anything in flight, including restore stages nothing else can see. They are in memory and forget on restart, which the tab says under Restore history when it is empty.
- Sp00ky Cloud, when linked, owns the catalog, the schedule, retention and deletion.
Linked, the catalog is the control plane’s list with each row joined to the
scheduler’s registry entry by id (the cloud worker uses its own row id as the
scheduler’s backup id, so the join is exact). Unlinked with S3 configured, the
catalog is a listing of {slug}/*.surql.gz in the bucket, where the slug is
SPKY_CLOUD_PROJECT or, failing that, SPKY_PROJECT_SLUG (default
default). That is enough to create and restore; there is no schedule,
retention or delete, and the tab says so instead of hiding the panels.
A restore reports the stages the scheduler actually goes through:
queued → running → main_db → replica → done
                                   ↘ failed
main_db means the main SurrealDB has been wiped and re-imported; replica
means the scheduler’s own replica followed. A restore that ends failed with
the main database restored but the replica not is the deliberately stuck
Restoring state described under Cloud → Backups; the
tab calls it out with the recovery step.
A restore wipes the database, evicts every SSP (they re-bootstrap against the restored state) and
requires your migrations to be run again. The dialog asks you to type restore before it
proceeds.
Who is connected, and what they registered
Two surfaces, split by the question each answers.
Overview carries the rollup, because “is anyone using this?” is a landing-page question: a band of four tiles — users, sessions and registered views, each with its count and its history, and a view-health tile with the shared / slow / errored counts. Each chart keeps its own scale; views outnumber users by one to two orders of magnitude, and a shared axis would flatten the users line onto the baseline.
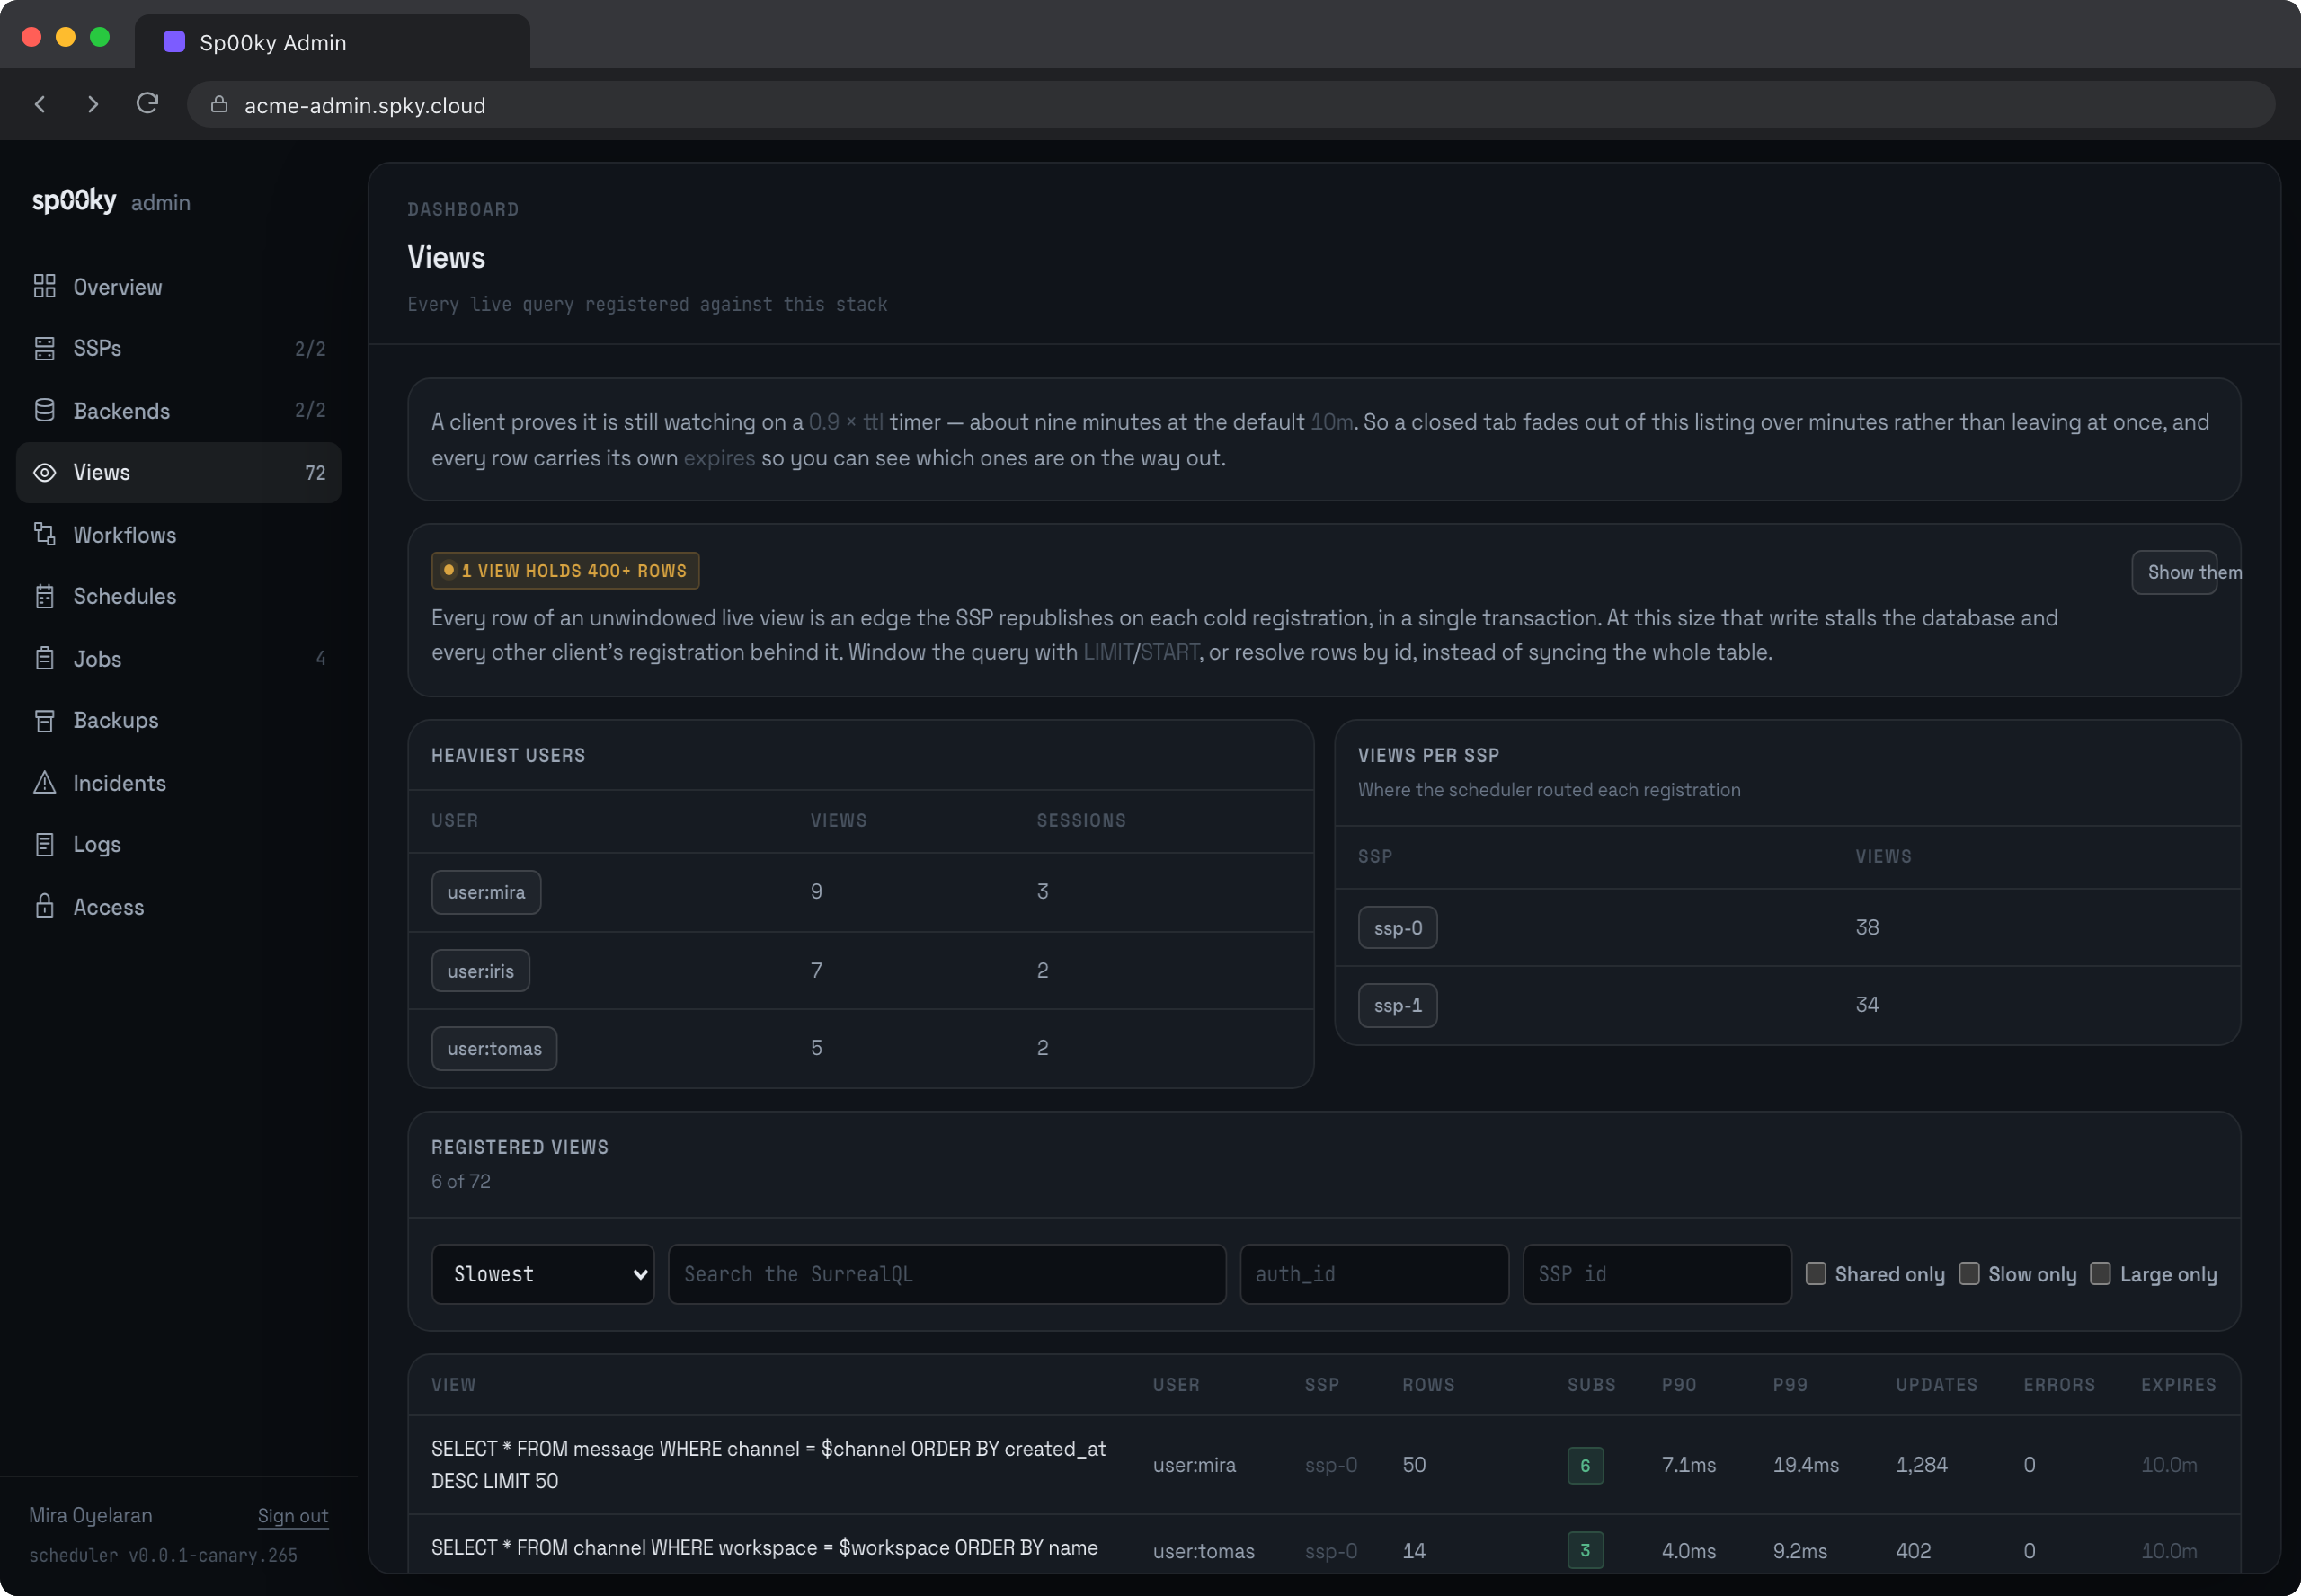
Views is the tab you open to ask which queries are registered: a filterable, sortable table of every live query with its owner, SSP, row count, subscribers, materialization percentiles and time to expiry. Clicking one opens its SurrealQL and params, every subscribing session with its age, that view’s heap inside its SSP, and the other live sessions running the identical query.
Everything is derived from _00_query, the registry of live queries. One row
there is one client session x query — the query id is hashed with a
per-browser-session salt, so two tabs of the same person register two rows.
That is what makes the rollup possible: distinct auth_id counts people,
distinct clientId counts open tabs, and the row count is registered views.
A client proves it is still watching by refreshing lastActiveAt on a0.9 × ttl
timer — about nine minutes at the default
10m. A row counts as live while lastActiveAt + ttl > time::now(), the
same rule the TTL sweep uses, so a closed tab decays out of these counts over minutes rather
than leaving at once. Every row on the Views tab carries its own expires so you can
see which ones are on the way out. There is no finer signal to be had: the client’s WebSocket goes
to SurrealDB, not to the scheduler, so there is no connection to count.
One background sampler feeds both surfaces, so ten open dashboards cost the database exactly what one does, and the totals ride the overview poll the app already makes rather than a request of their own.
Configuration
| Variable | Default | Meaning |
|---|---|---|
SPKY_ADMIN_ENABLED | true | Set to 0/false/off to disable the admin listener entirely |
SPKY_ADMIN_PORT | 9668 | Admin listener port |
SPKY_ADMIN_HOST | 0.0.0.0 | Admin listener bind address |
SPKY_ADMIN_DIR | /usr/share/spooky/dashboard | Where the built dashboard lives |
SPKY_ADMIN_PASSWORD | unset | Break-glass password. Unset disables password-only login |
SPKY_ADMIN_ACCESS | auto | Pins the record-access method used for sign-in |
SPKY_ADMIN_SESSION_TTL_SECS | 28800 | Session lifetime (8 hours) |
SPKY_ADMIN_PRESENCE_INTERVAL_SECS | 15 | How often the presence sampler reads _00_query. One sampler serves every open dashboard |
SPKY_ADMIN_SLOW_VIEW_MS | 250 | Materialization p99 at which a view counts as slow. ?slow_ms= overrides it per request |
SPKY_ADMIN_LARGE_VIEW_ROWS | 1000 | Row count from which a view is flagged large on the Views tab and the Overview. Every row of an unwindowed live view is republished as an edge on each cold registration, so a few thousand at once can stall the database; ?large=true filters the list to them |
SPKY_ADMIN_PRESENCE_MAX_ROWS | 20000 | Ceiling on rows one presence or views query may pull back |
SPKY_ADMIN_JOB_INTERVAL_SECS | 15 | How often the job sampler reads the outbox tables while nobody has the Jobs page open. 0 switches the sampler off: the Jobs list still works, the totals and the Overview tile report that they are not measured |
SPKY_ADMIN_JOB_LIVE_INTERVAL_SECS | 2 | The cadence while at least one dashboard holds /admin/api/jobs/stream open. Clamped to no slower than the idle interval |
SPKY_CLOUD_API_URL | unset | Sp00ky Cloud API base URL. Injected into the scheduler container by the control plane |
SPKY_CLOUD_PROJECT | unset | The project slug, injected alongside it |
SPKY_PROJECT_SLUG | default | Storage prefix for backups on an unlinked scheduler |
Backup storage is configured separately, and those five variables carry no
SPKY_ prefix: S3_ENDPOINT, S3_ACCESS_KEY, S3_SECRET_KEY, S3_BUCKET
and S3_REGION. The backup plane switches on as soon as any of the first four
is present, and each one falls back to a local-MinIO default when it is not, so
set them deliberately rather than partially. Sp00ky Cloud injects them for you;
self-hosters set them by hand, and
Self-hosting lists them with their defaults.
Without them the Backups tab still loads and says storage is unconfigured, and
POST /admin/api/backups answers 503.
The scheduler counts as linked when SPKY_CLOUD_API_URL,
SPKY_CLOUD_PROJECT and SPKY_AUTH_SECRET are all set. The first two are not
secrets; the credential is the SPKY_AUTH_SECRET the scheduler already holds
as its cluster identity, which the control plane accepts on a small,
allow-listed route family for that one project. No new credential is minted
or stored. GET /admin/api/config reports the result as cloud_linked.
Running from a checkout
The dashboard is shipped as files rather than embedded in the binary, so
cargo build -p scheduler needs no Node toolchain. A scheduler with no bundle
starts normally, logs one warning, and serves a short placeholder page at
/admin; the API on that port is unaffected.
To build and serve it locally:
pnpm --filter @spooky-sync/dashboard build
SPKY_ADMIN_DIR=apps/dashboard/dist cargo run -p scheduler
API
Every endpoint is under /admin/api on the admin port. All require
Authorization: Bearer <token> except GET /admin/api/config.
Two routes sit outside that prefix: the built dashboard itself, served from
/admin, and GET /, which answers a 301 to /admin/ so typing the host
and port with no path lands on the dashboard.
| Endpoint | Purpose |
|---|---|
GET /admin/api/config | Scheduler id, version, breakglass_available, cloud_linked, supervised, sessions_persistent, project_slug. Unauthenticated |
POST /admin/api/session | Sign in. {username, password} or {password} for break-glass |
POST /admin/api/logout | Revoke the current token |
GET /admin/api/me | Current session’s subject, label, mode and scope |
GET /admin/api/overview | Scheduler, SSP and backend entities plus totals, and the presence rollup |
GET /admin/api/presence | Live users, sessions and views, the sample ring behind the charts, the heaviest users and the per-SSP split. Served from the sampler’s memory |
GET /admin/api/views | Registered live queries. ?limit=, ?user=, ?ssp=, ?sort=, ?slow_ms=, ?q=, ?shared=, ?include_expired= |
GET /admin/api/views/:key | One view: SurrealQL, params, subscribers, percentiles, its SSP’s memory attribution, and the other sessions running the identical query |
GET /admin/api/backends | Backend list |
GET /admin/api/backends/:name | One backend with probe history and masked env |
GET /admin/api/logs | SSE. ?source=scheduler or ssp:<id>, &tail=, &backfill= |
GET /admin/api/workflows/runs | Run list. ?name=, ?schedule=, ?status=, ?rerun_of=, ?limit= |
GET /admin/api/workflows/runs/:id | One run with its steps and DAG |
GET /admin/api/workflows/stream | SSE. Run list, pushed on change |
GET /admin/api/jobs | Outbox jobs across every table, newest activity first, with the queue totals and a per-table breakdown. ?status=, ?table=, ?origin=schedule|workflow|app, ?q=, ?limit=. Unfiltered it is served from the sampler’s memory and costs the database nothing |
GET /admin/api/jobs/stream | SSE. Event jobs, the list and totals pushed on change. Holding it open is what puts the sampler on its live cadence. 501 when the sampler is disabled |
GET /admin/api/jobs/:id | One outbox job: status, path, payload, result, every attempt in errors, retry budget, assignee, lease, and the origin block naming the schedule fire or workflow step it came from. 404 unless the id’s table is in _00_retention.job_tables |
GET /admin/api/schedules | Schedule definitions with next/last fire |
GET /admin/api/schedules/:name | One schedule, its recent fires, and its _00_run_rollup tally |
GET /admin/api/operations | Recent operations, newest first |
GET /admin/api/operations/stream | SSE. Event operations, the whole list on every change |
POST /admin/api/ssps/:id/restart | {mode: "restart" | "clean" | "reload"}. 202 with the operation |
POST /admin/api/ssps/restart-all | {mode: "restart" | "clean", rolling: true}. 409 while a roll is running |
POST /admin/api/scheduler/restart | {mode: "restart" | "reclone" | "rehash"} |
POST /admin/api/cloud/restart | {roles, upgrade, clean, surreal}, forwarded to Sp00ky Cloud. 409 when unlinked |
GET /admin/api/cloud/deployment | The deployment as Sp00ky Cloud sees it. 409 when unlinked |
GET /admin/api/backups | Catalog, local registry, restores, schedule config, storage status |
POST /admin/api/backups | {name}. 202 with the operation and backup_id. 503 without S3 storage |
PUT /admin/api/backups/config | {enabled, schedule, retention}. 409 when unlinked |
DELETE /admin/api/backups/:id | Soft-delete in the catalog. 409 when unlinked |
POST /admin/api/backups/:id/restore | 202 with the operation and restore_id. 503 unless the scheduler is Ready |
GET /admin/api/backups/:id/restore | {cloud, local, stage} for the latest restore of that backup |
POST /admin/api/workflows/runs/:id/cancel | 202 {run, status: "killed" | "kill_requested"} |
POST /admin/api/workflows/runs/:id/rerun | 201 {run, rerun_of} |
POST /admin/api/workflows/runs/:id/retry | 200 {run, retry_count, reset, kept} |
POST /admin/api/schedules/:name/pause | {name, paused: true} |
POST /admin/api/schedules/:name/resume | {name, paused: false} |
POST /admin/api/schedules/:name/trigger | {name, triggered_at}. 409 when paused or config-disabled |
GET /admin/api/pools | Every machine pool: sizing, pause and breaker state, machines by state, busy slots, jobs waiting for a machine |
GET /admin/api/pools/:name/machines | One pool’s machines, newest first, terminal ones included: state, slots in use, last contact, why it was taken away |
POST /admin/api/pools/:name/pause | No new jobs assigned and no machines created; running jobs finish. Survives redeploys |
POST /admin/api/pools/:name/resume | Resume a paused pool |
POST /admin/api/machines/:id/drain | The machine takes no new jobs, finishes what it runs, and is destroyed |
POST /admin/api/jobs/:id/kill | The cluster kill, relaying the SSPs’ answer |
POST /admin/api/jobs/:id/retry | The cluster retry, relaying the SSP’s answer |
POST /admin/api/jobs/clear | {table, all}. Batch-deletes terminal rows, never processing ones. 200 {cleared, total, more} |
POST /admin/api/tokens | {label, scope: "read" | "full", ttl_days}. 201 with the token, shown once. 403 for an MCP or read-only session |
DELETE /admin/api/tokens | {token}. Revokes it. 204 |
POST /admin/api/mcp | The scheduler admin MCP server: JSON-RPC over Streamable HTTP, stateless. GET and DELETE answer 405 |
A 503 on the login screen —
“Cannot reach the tenant database, so no sign-in can be checked” — is not a credential
problem and no password will fix it. The roster path signs in through your database, so
it needs that database reachable; when it is not, the scheduler says so instead of answering
401. Check the scheduler’s log for the reason and the database container’s health. A
tenant database can reach a state where it keeps answering existing connections and its REST
endpoints while refusing new SDK sessions, so “the app still works” does not rule this out;
restarting the database container clears it.
retry_count on _00_workflow_run became
option<int>: as a plain int every update to a run created before
the field existed failed validation, which blocked cancel and the engine’s own finalize on those
rows. spky migrate applies the new definition and a one-time backfill; run it once
after upgrading.
The workflow endpoints are served by the scheduler rather than read from the
database directly because _00_workflow_run, _00_step_run and
_00_schedule_run are PERMISSIONS NONE — no record-auth token can read them.
The scheduler holds root and is the cluster’s only schedule ticker, which makes
it the right place to serve them.
Why a row ended the way it did
Every skip, kill and failure the engine records carries a structured cause on the
row’s error field — a stable code, a sentence, and whatever ids make the
sentence actionable — and the dashboard renders that rather than a JSON payload.
The ones worth knowing by name:
code | On | Means |
|---|---|---|
concurrency_skip | _00_schedule_run | The fire was suppressed by concurrency: skip. blocked_by is the run holding the key and since is when it started. A run wedged in running suppresses that key’s fires for as long as it stays there, so the blocking run is what needs acting on — not the skipped rows |
upstream_failed | _00_step_run | The step is below a failure under on_failure: continue-independent. blocked_by names the dependency one hop up, so the chain can be walked a step at a time |
run_halted | _00_step_run | The step had not started when the run halted under on_failure: halt. failed_steps names what actually broke, which is elsewhere in the DAG |
not_started | _00_step_run | The run was killed or reaped before this step started. run_error carries the run’s own reason |
never_dispatched | _00_step_run | The step was promoted but its job row was never created, and the run stopped before recovery re-dispatched it |
lost_dispatch | _00_step_run | The step exhausted its dispatch attempts without ever getting a job |
job_failed | _00_step_run, _00_schedule_run | The step’s job failed. Normally the job’s last errors entry verbatim; synthesized, and saying so, when the job recorded none |
job_missing | _00_step_run, _00_schedule_run | The job row is gone — deleted, or pruned by retention while the step still pointed at it |
step_failed | _00_workflow_run | A step failed and the run failed with it. The step’s own row carries the real reason |
deadline_exceeded | _00_workflow_run, _00_schedule_run | The reaper stopped a run that passed its deadline: (or the project’s run_deadline_secs) without finishing, and killed its jobs |
killed | _00_workflow_run, _00_schedule_run | An operator cancelled the run |
spawn_failed | _00_workflow_run, _00_schedule_run | The fire could not create what it needed — the job row, or the run’s steps |
bad_dag | _00_workflow_run | The frozen DAG on the run does not validate. A redeploy cannot fix a run already in flight; its DAG is frozen at spawn |
no_target_table | _00_step_run | The step names no outbox table and its schedule has no target_table |
_00_schedule.last_error is the exception: it is a bare string, because it is why
a schedule could not be planned or fanned out at all (a bad cron, a failing
forEach) — which happens before any run row exists to carry a cause.
Each step in GET /admin/api/workflows/runs/:id carries both created_at and
started_at, and the distinction matters: the engine creates every step row when
the run is spawned, so created_at on a step deep in a DAG is the run’s start,
not the step’s. started_at is stamped when the step’s job is created and is the
only honest answer to “when did this begin”. The Timeline draws from it, and
falls back to the moment the step’s last dependency finished — marked as an
estimate — for runs recorded before the engine stamped it.
Incident details show publication backlog when an SSP heartbeat sample was available: peak queued operations and bytes, longest observed wait, parked batches, last successful publication, and related view links. Bulk database session generation and reconnect timing distinguish database recovery from circuit evaluation. The SSP page also shows its current publication backlog. These are sampled measurements; a spike between samples can be missed.
Regenerating these screenshots
They are captured from the real dashboard driven by a fixed fixture, not by hand:
See apps/dashboard/screenshots/README.md for what to update when a route is
added or a response shape changes.